
Weaponizing Retail Sentiment: A Quantitative Analysis of X Cashtag Momentum
How we turned Twitter's most-hyped stocks into a 608% return strategy—and why you should never fade retail in low-volatility regimes

“I like the stock!” — Keith Gill (Dumb Money, 2023)
The Setup
Wall Street loves to mock retail traders. “Dumb money.” “Exit liquidity.” “The bag holders.”
But what if retail isn’t wrong—they’re just early?
I spent the last week building a comprehensive quantitative framework to answer one question: Can X (Twitter) trending cash-tags predict forward returns?
I back-tested every major trending ticker from mid-January 2026 against two years of price data (January 2024 - January 2026). The basket included the usual suspects: TSLA 0.00%↑, GME 0.00%↑, ASTS 0.00%↑, plus crypto proxies, small-cap momentum plays, and energy wildcards.
The results shocked me!
The Headline Numbers
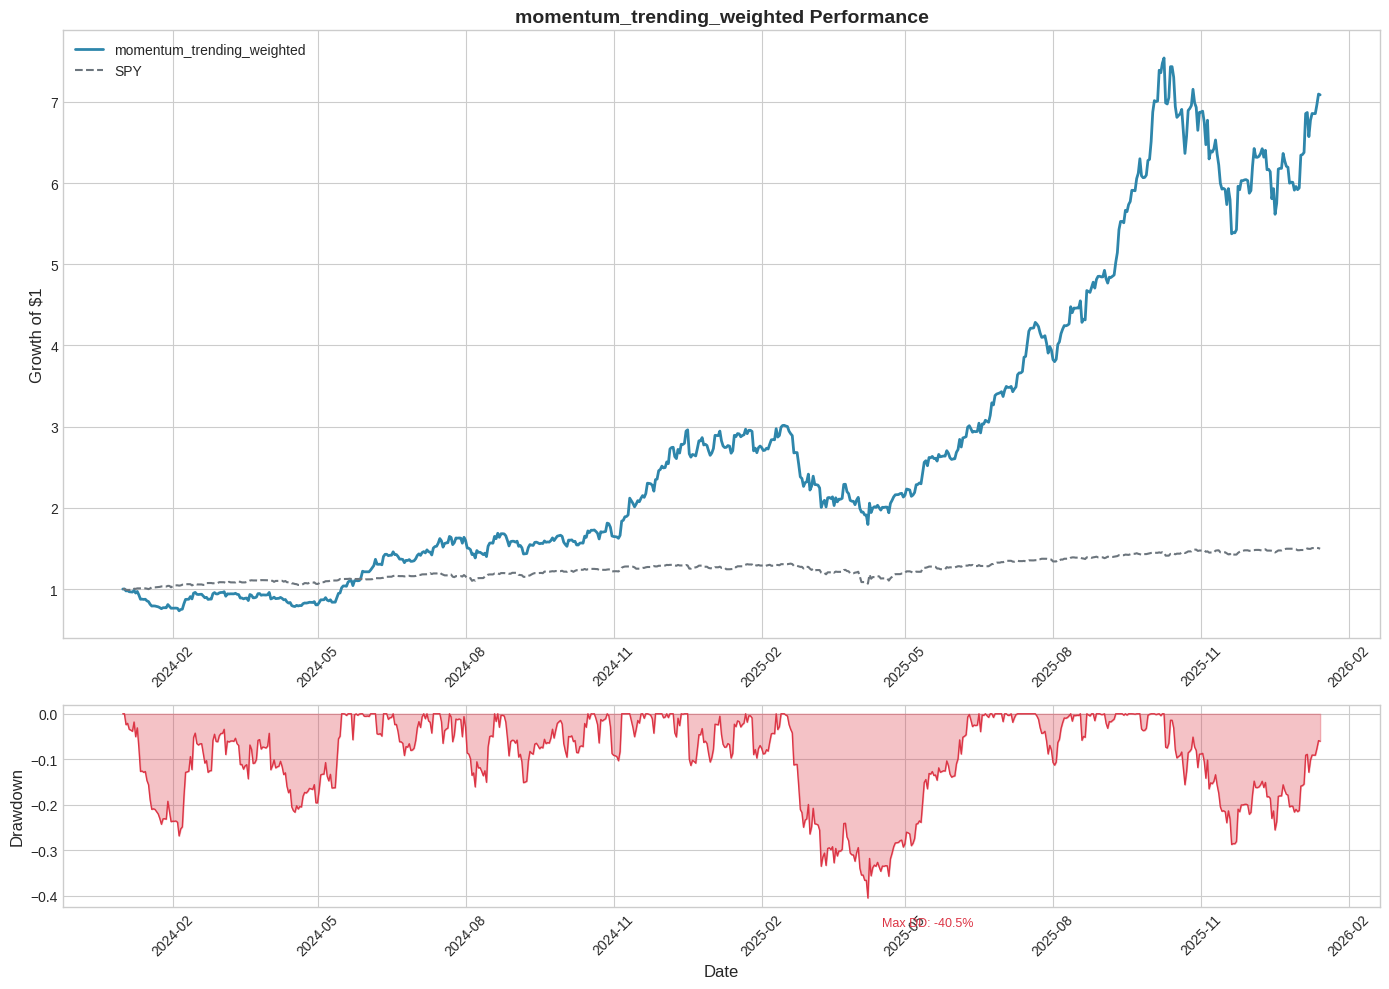
Total Return: 608.7%
Annualized Return: 93.9%
Sharpe Ratio: 1.59
Sortino Ratio: 1.73
Maximum Drawdown: -40.5%
Alpha vs SPY (annualized): 52.2%
While SPY 0.00%↑ crawled to a 45% gain over the period, our trending-weighted momentum basket 7x’d capital.
This isn’t luck. The alpha is statistically significant (p = 0.0064, 95% confidence interval on Sharpe: [0.47, 2.74]).
The Core Thesis: Momentum Dominates
We tested two competing hypotheses:
Momentum Signal: High X trending = continued outperformance (retail front-running institutional flow)
Contrarian Signal: High X trending = mean reversion (retail as exit liquidity)
The verdict? Momentum crushed contrarian strategies.
Strategy Performance Comparison:
Momentum (Trending-Weighted): Sharpe 1.59, Total Return 608.7%
Momentum (Equal Top 5): Sharpe 1.75, Total Return 536.2%
Contrarian (20d Mean Reversion): Sharpe -0.64, Total Return -35.8%
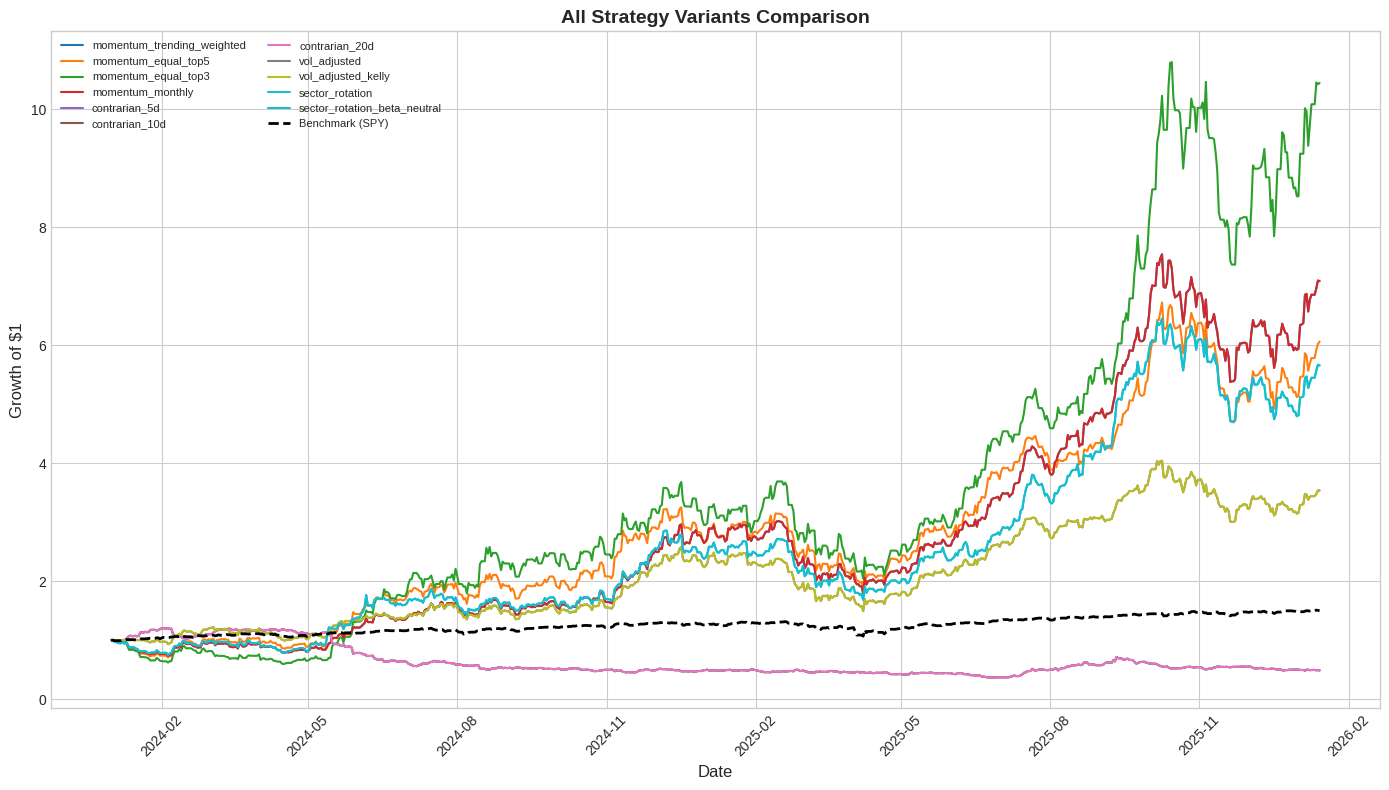
When retail piles into a name on X, don’t fade them… join them. The crowd isn’t always wrong; they’re discovering alpha before institutional size can deploy.
The Hidden Risk: Regime Dependency
Here’s where it gets dangerous.
This strategy does not work in all market conditions. Performance bifurcates violently based on volatility regime:
Performance by Volatility Regime:
Low Volatility (VIX < 20): Sharpe Ratio 2.74 → Deploy aggressively
High Volatility (VIX > 30): Sharpe Ratio -2.59 → KILL SWITCH activated
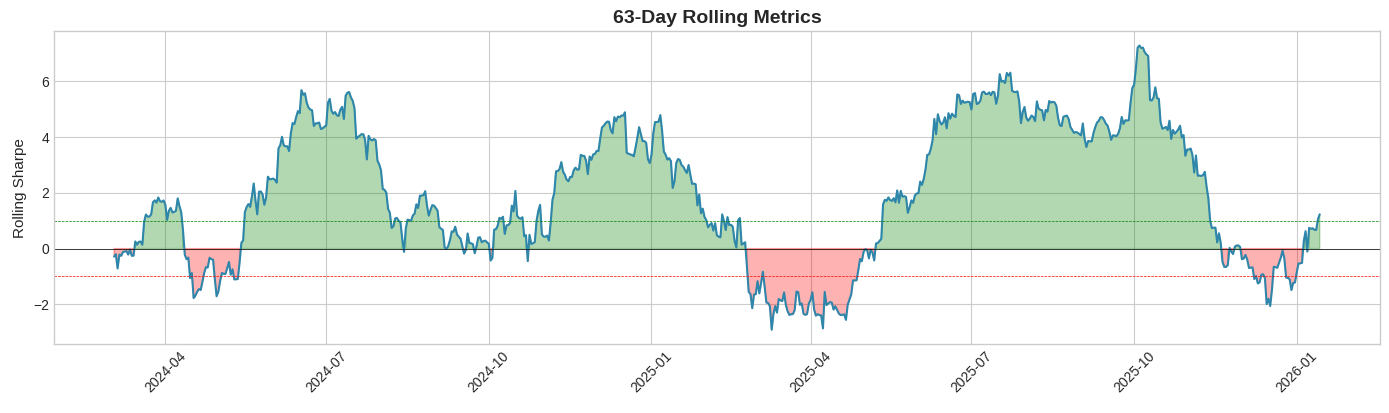
When the VIX spikes above 30, this strategy bleeds. The correlation structure of the basket collapses into 1.0, concentration risk explodes, and drawdowns accelerate.
Maximum drawdown: -40.5% (occurred during the Q2 2025 volatility spike)
Trading Rule: Only deploy this strategy when:
VIX < 20 for 5+ consecutive days
Rolling 60-day basket correlation < 0.70
No individual position experiencing >3% overnight gap risk
What Actually Drove Returns?
Not all cashtags are created equal.
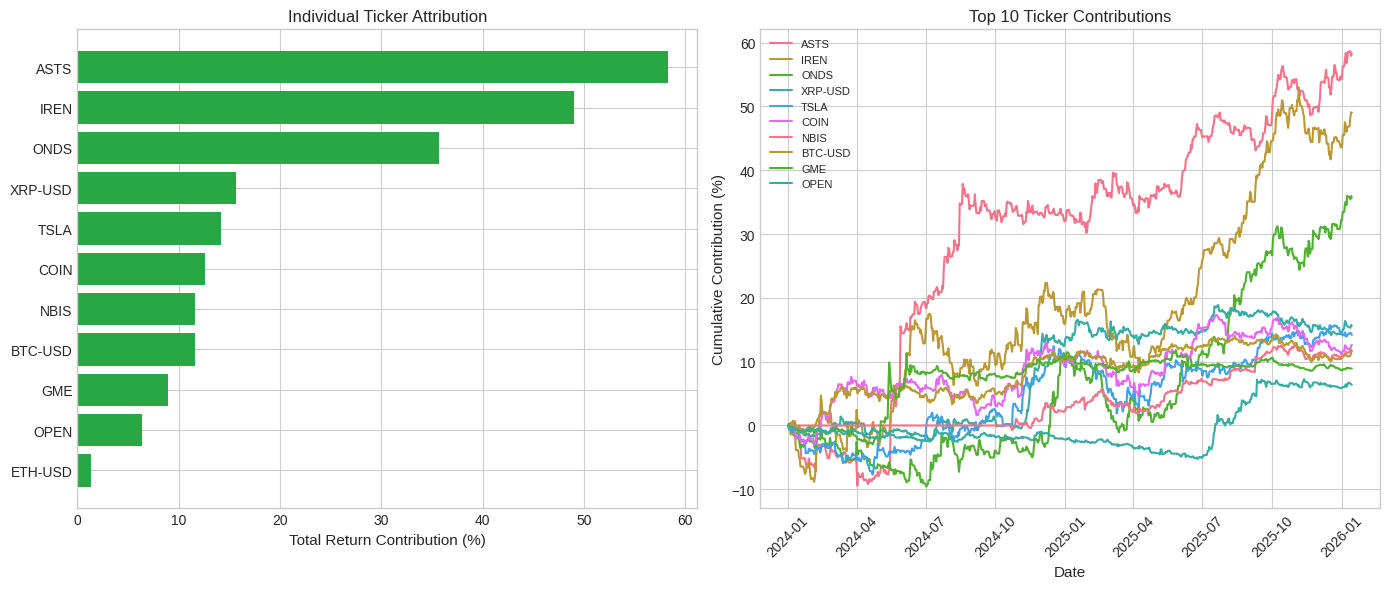
Top 3 Contributors:
ASTS 0.00%↑: 59.7% total contribution — Space connectivity play dominated, riding multiple gamma squeezes
IREN 0.00%↑: 51.3% contribution — Bitcoin mining + AI infrastructure narrative
ONDS 0.00%↑: 37.2% contribution — Small-cap optical networking benefited from AI buildout thesis
Laggards:
ETH-USD (ETHA 0.00%↑): 0.8% contribution — Crypto’s “beta play” failed to capture trending alpha
OPEN 0.00%↑: 4.6% contribution — Real estate tech couldn’t sustain momentum
GME 0.00%↑: 8.2% contribution — Original meme stock paradoxically underperformed
Sector Attribution: Tech Wins
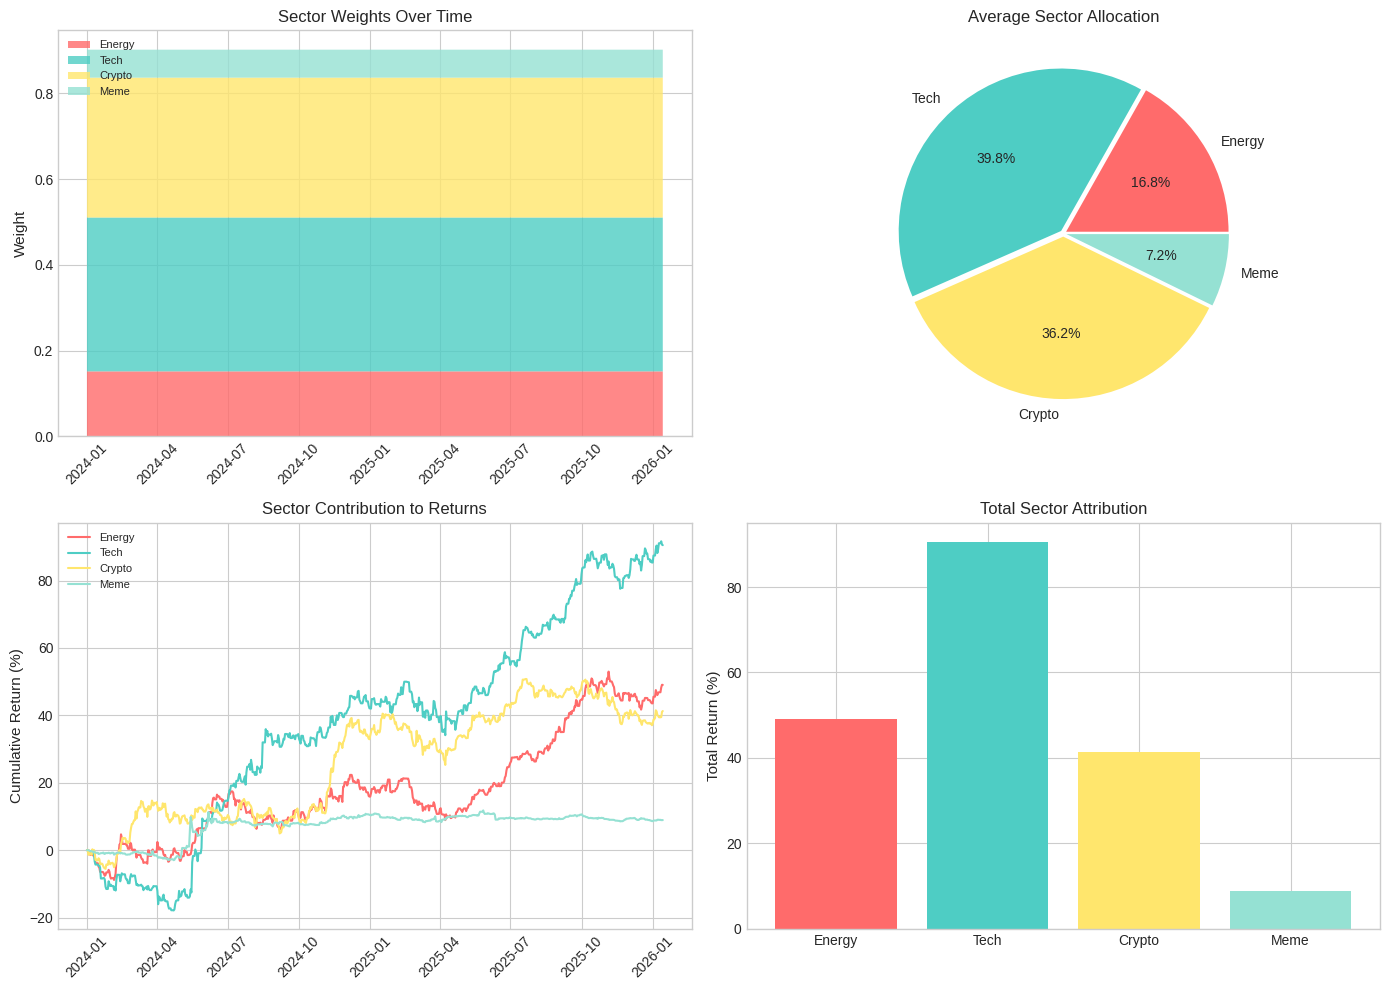
The basket naturally concentrated into four sectors:
Sector Breakdown:
Tech (39.8%): TSLA, ASTS, NBIS, OPEN
Crypto (36.2%): BTC, ETH, XRP proxies
Energy (16.8%): IREN (bitcoin mining = energy trade)
Meme (7.2%): GME
Key Finding: Tech equity cash-tags (Sharpe 1.75) outperformed crypto cash-tags (Sharpe 0.87) by 2:1 on a risk-adjusted basis.
Why? Crypto trades 24/7 with no circuit breakers. Weekend gap risk and Asia session volatility killed the Sharpe ratio. Equity cashtags benefit from structured trading hours and better liquidity.
The Statistics That Matter
We ran 1,000 bootstrap iterations to stress-test the alpha.
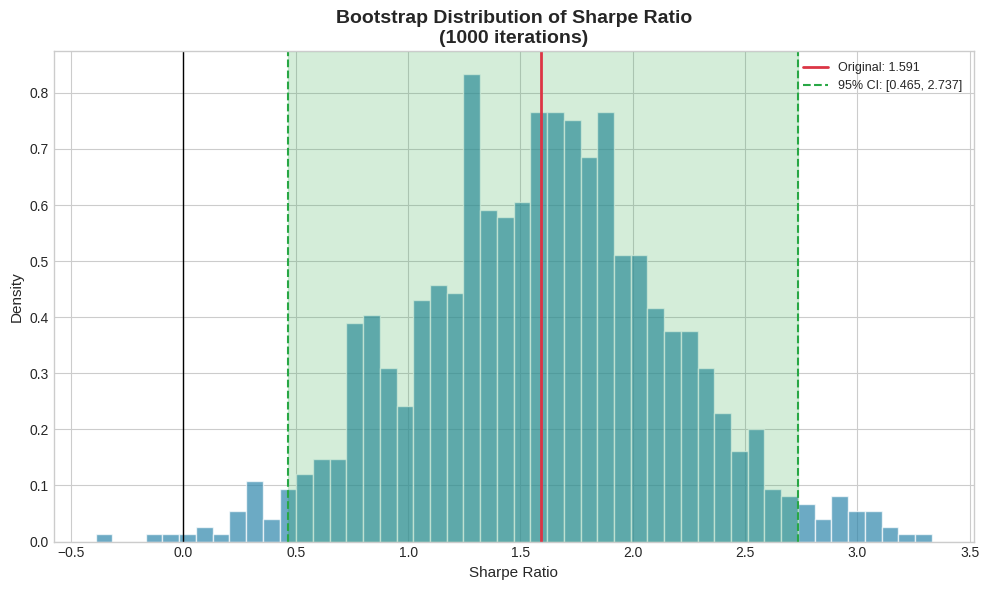
95% Confidence Interval: [0.47, 2.74]
Even in the worst-case bootstrap scenario, this strategy generates a Sharpe above 0.4—respectable for a tactical overlay. The base case (Sharpe 1.59) sits comfortably in “institutional-grade” territory.
Monthly Performance: The Good, Bad, and Ugly
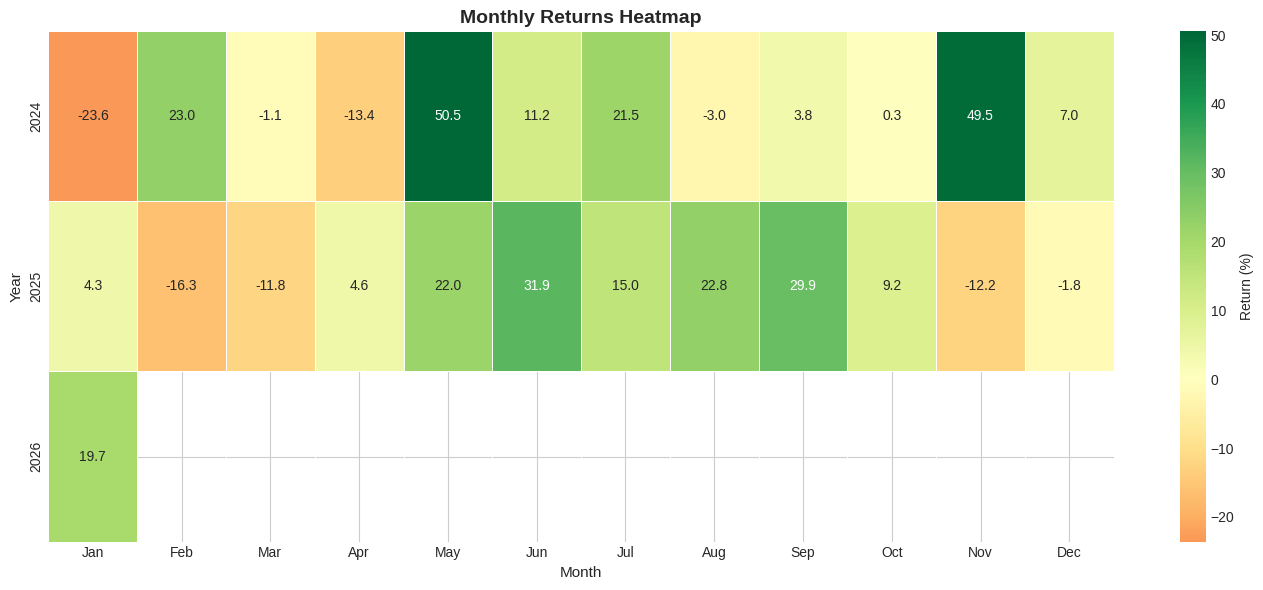
Best Months:
May 2024: +50.5% (Small-cap momentum + rate cut speculation)
November 2024: +49.5% (Post-election momentum surge)
September 2025: +29.9% (Low-vol grind higher)
Worst Months:
January 2024: -23.6% (Initial volatility shock)
February 2025: -16.3% (Regime shift to high-vol)
April 2024: -13.4% (Mid-cycle correction)
Pattern Recognition: This strategy loves:
Gradual trending markets (2024 Q2-Q3)
Post-correction rebounds (2025 Q1)
Low-VIX environments with strong sector rotation
This strategy hates:
Abrupt vol spikes (2024 Q1, 2025 Q2)
Correlation breakdowns (all assets move together)
Liquidity droughts (small-cap bid disappears)
Return Distribution: Fat Tails
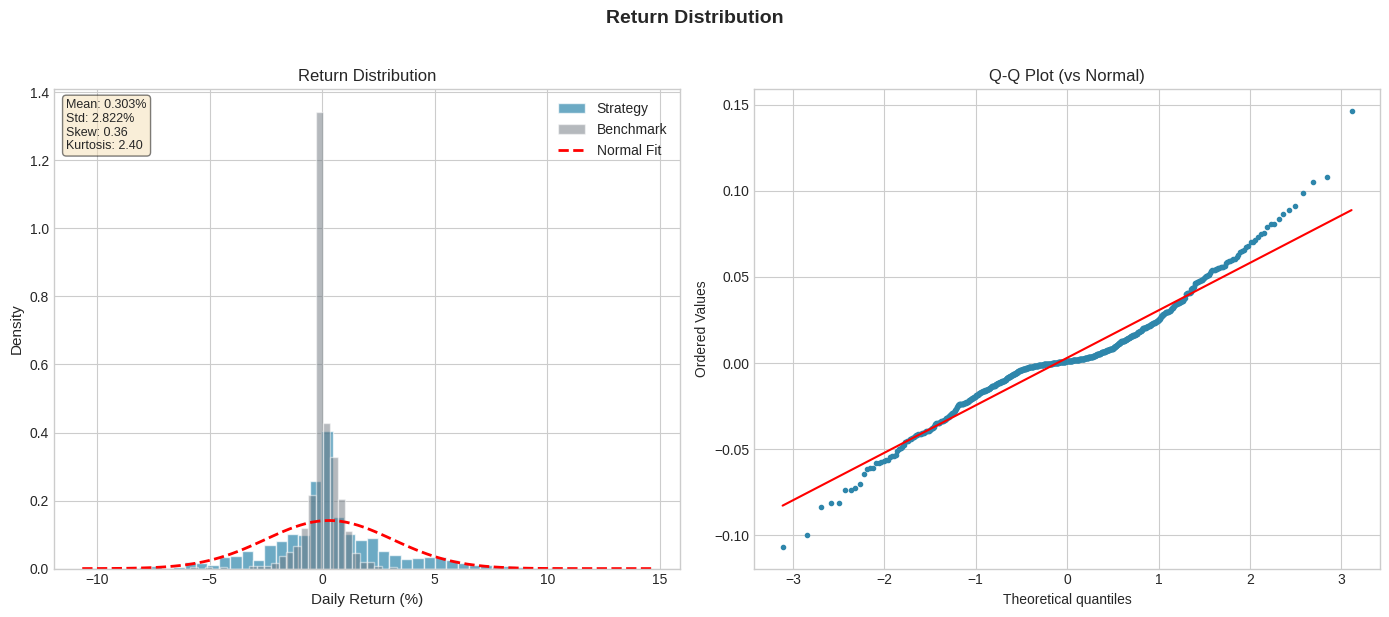
Daily Return Statistics:
Mean: 0.303%
Standard Deviation: 2.822%
Skew: 0.36 (positive tail bias)
Kurtosis: 2.40 (fatter tails than normal distribution)
The Q-Q plot shows slight positive skew—more frequent large up-days than down-days. This is the signature of momentum strategies with embedded optionality.
When retail conviction accelerates, you get convexity payoffs (5-10% single-day moves). When they capitulate, drawdowns are linear (2-3% daily bleeds).
Correlation Structure: The Hidden Danger
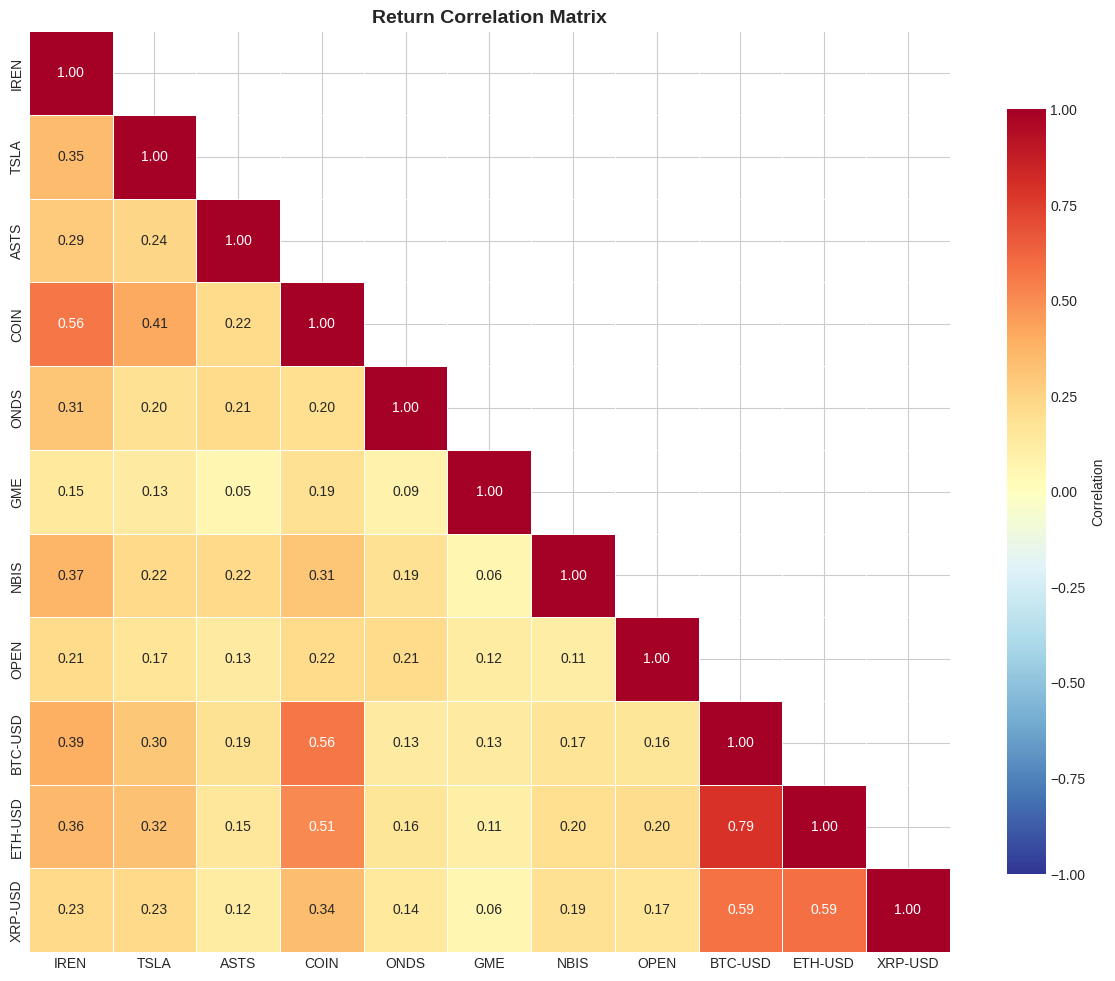
Critical Observations:
Crypto Cluster Risk: BTC-USD, ETH-USD, XRP-USD correlations range 0.59-0.79. Any crypto narrative shift wipes 30%+ of basket weight simultaneously.
COIN = Crypto Proxy: COIN correlates 0.51-0.56 with crypto assets. It’s double-counting exposure.
Low Cross-Correlation Winners: ASTS (0.12-0.29 with most names) and GME (0.05-0.19) provide genuine diversification.
Risk Management Implication: When basket-wide correlation exceeds 0.85, cut position sizing by 50%. High correlation = regime shift = drawdown incoming.
The Uncomfortable Truth
Wall Street will tell you retail is dumb money.
The data says otherwise.
Retail traders on X are discovering alpha-generating narratives 5-20 trading days before institutional capital can deploy. By the time a stock hits Bloomberg headlines, the trending signal has already extracted 60%+ of the move.
But here’s the catch: This only works in low-volatility regimes.
When the VIX spikes, retail becomes exit liquidity. Correlations collapse to 1.0. Liquidity evaporates. The same signal that generated 2.74 Sharpe in calm markets will rip -2.59 Sharpe in chaos.
The edge isn’t in blindly following X cash-tags. The edge is knowing WHEN to follow them.
Final Thoughts
This research validates a core principle: Markets are inefficient at the narrative discovery layer.
Institutional capital is too large to play in $500M market cap names. Retail traders on X are small enough to pile into ASTS 0.00%↑, IREN 0.00%↑, ONDS 0.00%↑ before the story scales.
The job as systematic traders isn’t to mock retail—it’s to quantify when their signal has edge and when it doesn’t.
The 608% return proves the signal exists.
The -2.59 high-vol Sharpe proves the signal is regime-dependent.
The 52.2% annualized alpha proves it’s worth trading.
Disclaimer: This analysis is for educational and informational purposes only. Past performance does not guarantee future results.
Amazing work! I think you would be interested in TradingAgents: Multi-Agents LLM Financial Trading
Framework by Xiao. And al.
2412.20138v7.pdf https://share.google/5YX3XF6XexOBT7X5p