Time to Sell Korea?
How Quantitative Flow Analysis, Vol Surface Anomalies, and Currency Structure Identified a High-Conviction Setup

"If you're not on Bloomberg, you're not in the game." — Wall Street
How We Found This Trade
The signal didn’t come from a news headline or a hot take on social media. It came from systematically reading the options tape.
Every day, I run through Bloomberg’s Most Active Options screen (MOSO) — a real-time ranking of the day’s highest-volume options contracts across the entire listed market. It’s one of the cleanest windows into where institutional capital is actually moving. Not where analysts say it’s moving. Where it’s actually going.
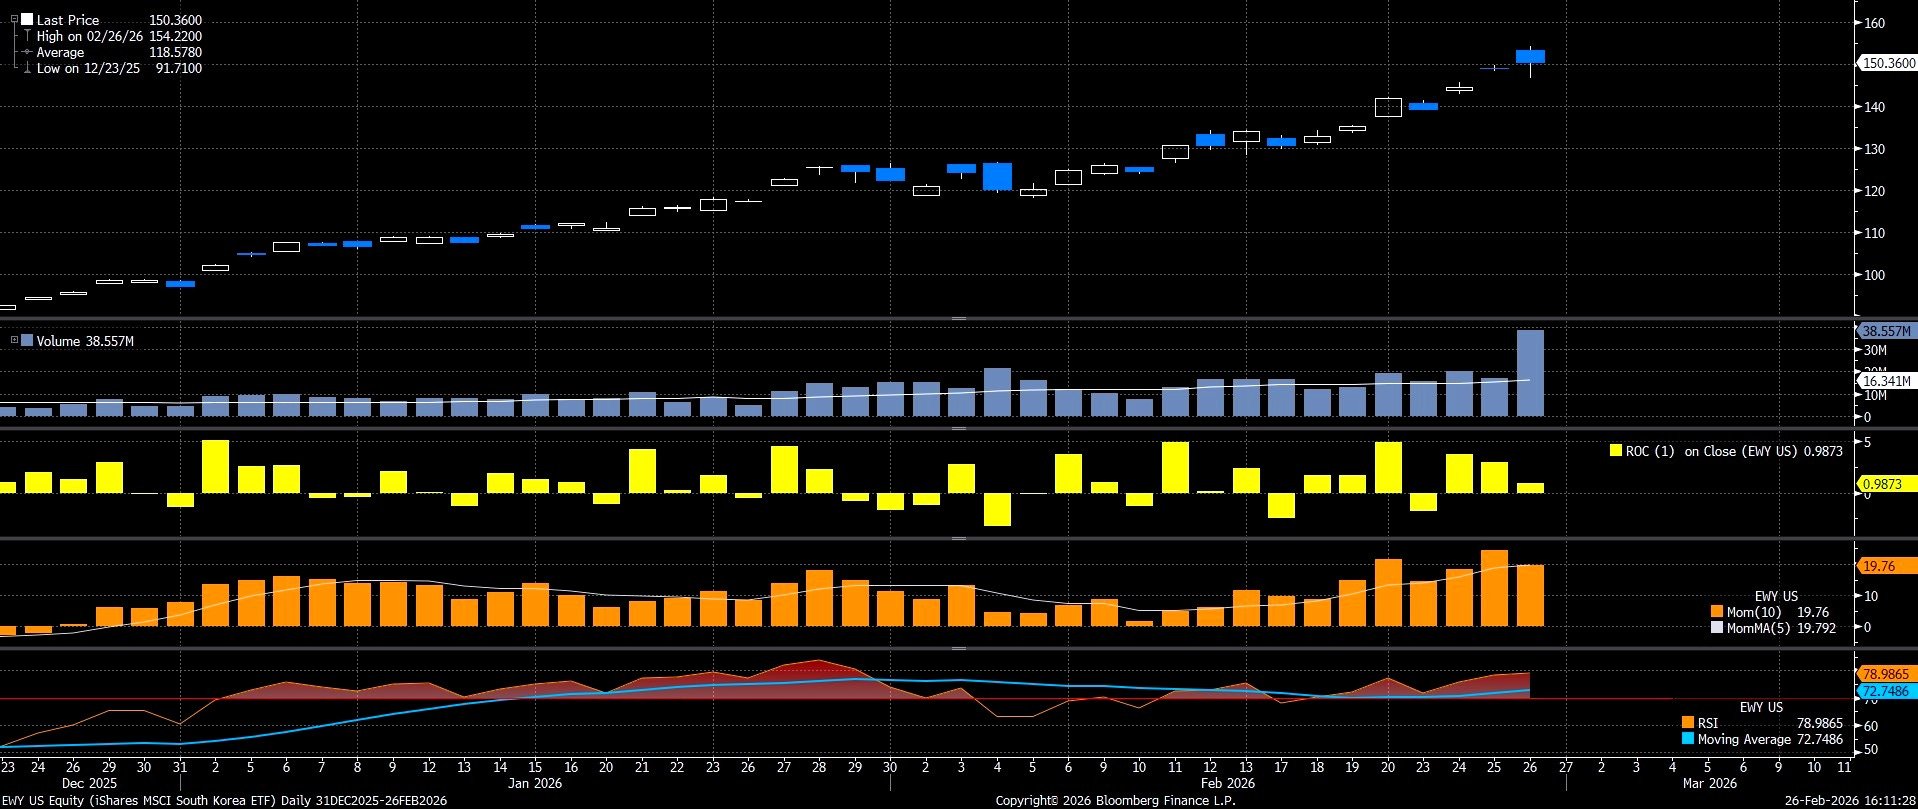
Today’s MOSO data flagged something specific on EWZ 0.00%↑: roughly 24,000 EWY March $142 Put contracts trading at elevated volume, with implied volatility readings that lit up every statistical filter I track. That was the entry point into a deeper investigation. What followed was a systematic, multi-layer analysis across Bloomberg’s analytical suite — Historical Beta (HRA), Graph Volatility (GV), Spread Analysis, and the currency rate terminal — that built a complete picture of a compelling short setup.
Here’s the full intelligence breakdown.