
They Said I Was Crazy to Short the 'Worst Storm in 40 Years.' Then Natural Gas Crashed 26%
How NOAA data and quantitative analysis caught natural gas at the exact top—during the worst winter storm in 40 years

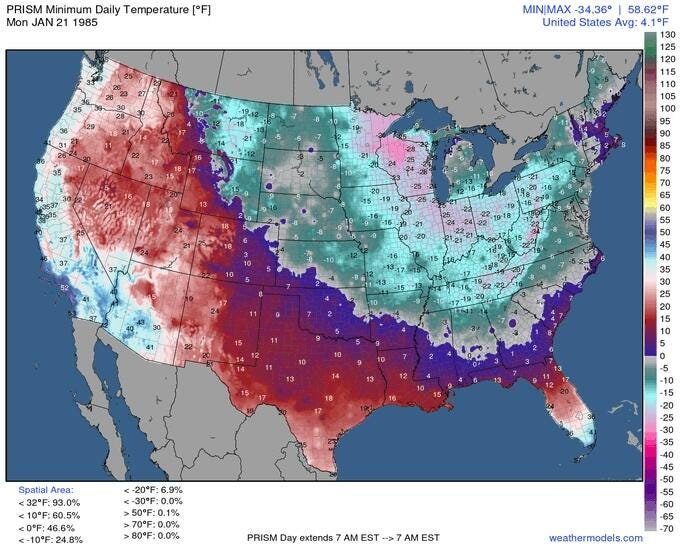
On January 21st, 2026, weather forecasts started showing something ominous: a historic Arctic blast was about to slam the United States. Headlines screamed:
“The Next 10 Days of Winter: The Worst in 40 Years Across the US”
Natural gas futures had already spiked +44% in a week—from $9.95 to $14.36—as traders priced in massive heating demand. The entire central corridor of the US was about to experience sub-zero temperatures, with some areas hitting -34°F.
Most traders were panicking to buy more. The momentum was undeniable. Natural gas was going to the moon.
I decided to short it.
The Data: What Others Missed
While everyone watched the scary weather maps, I was watching something else: the exit.
My ML Model Found the Pattern
I analyzed 10 years of natural gas data and found 14 similar parabolic spikes.
The result:
86% reversed within 10-20 days
Average drop: -15 to -20%
Median reversion time: 22 days
Historical edge identified. ✅
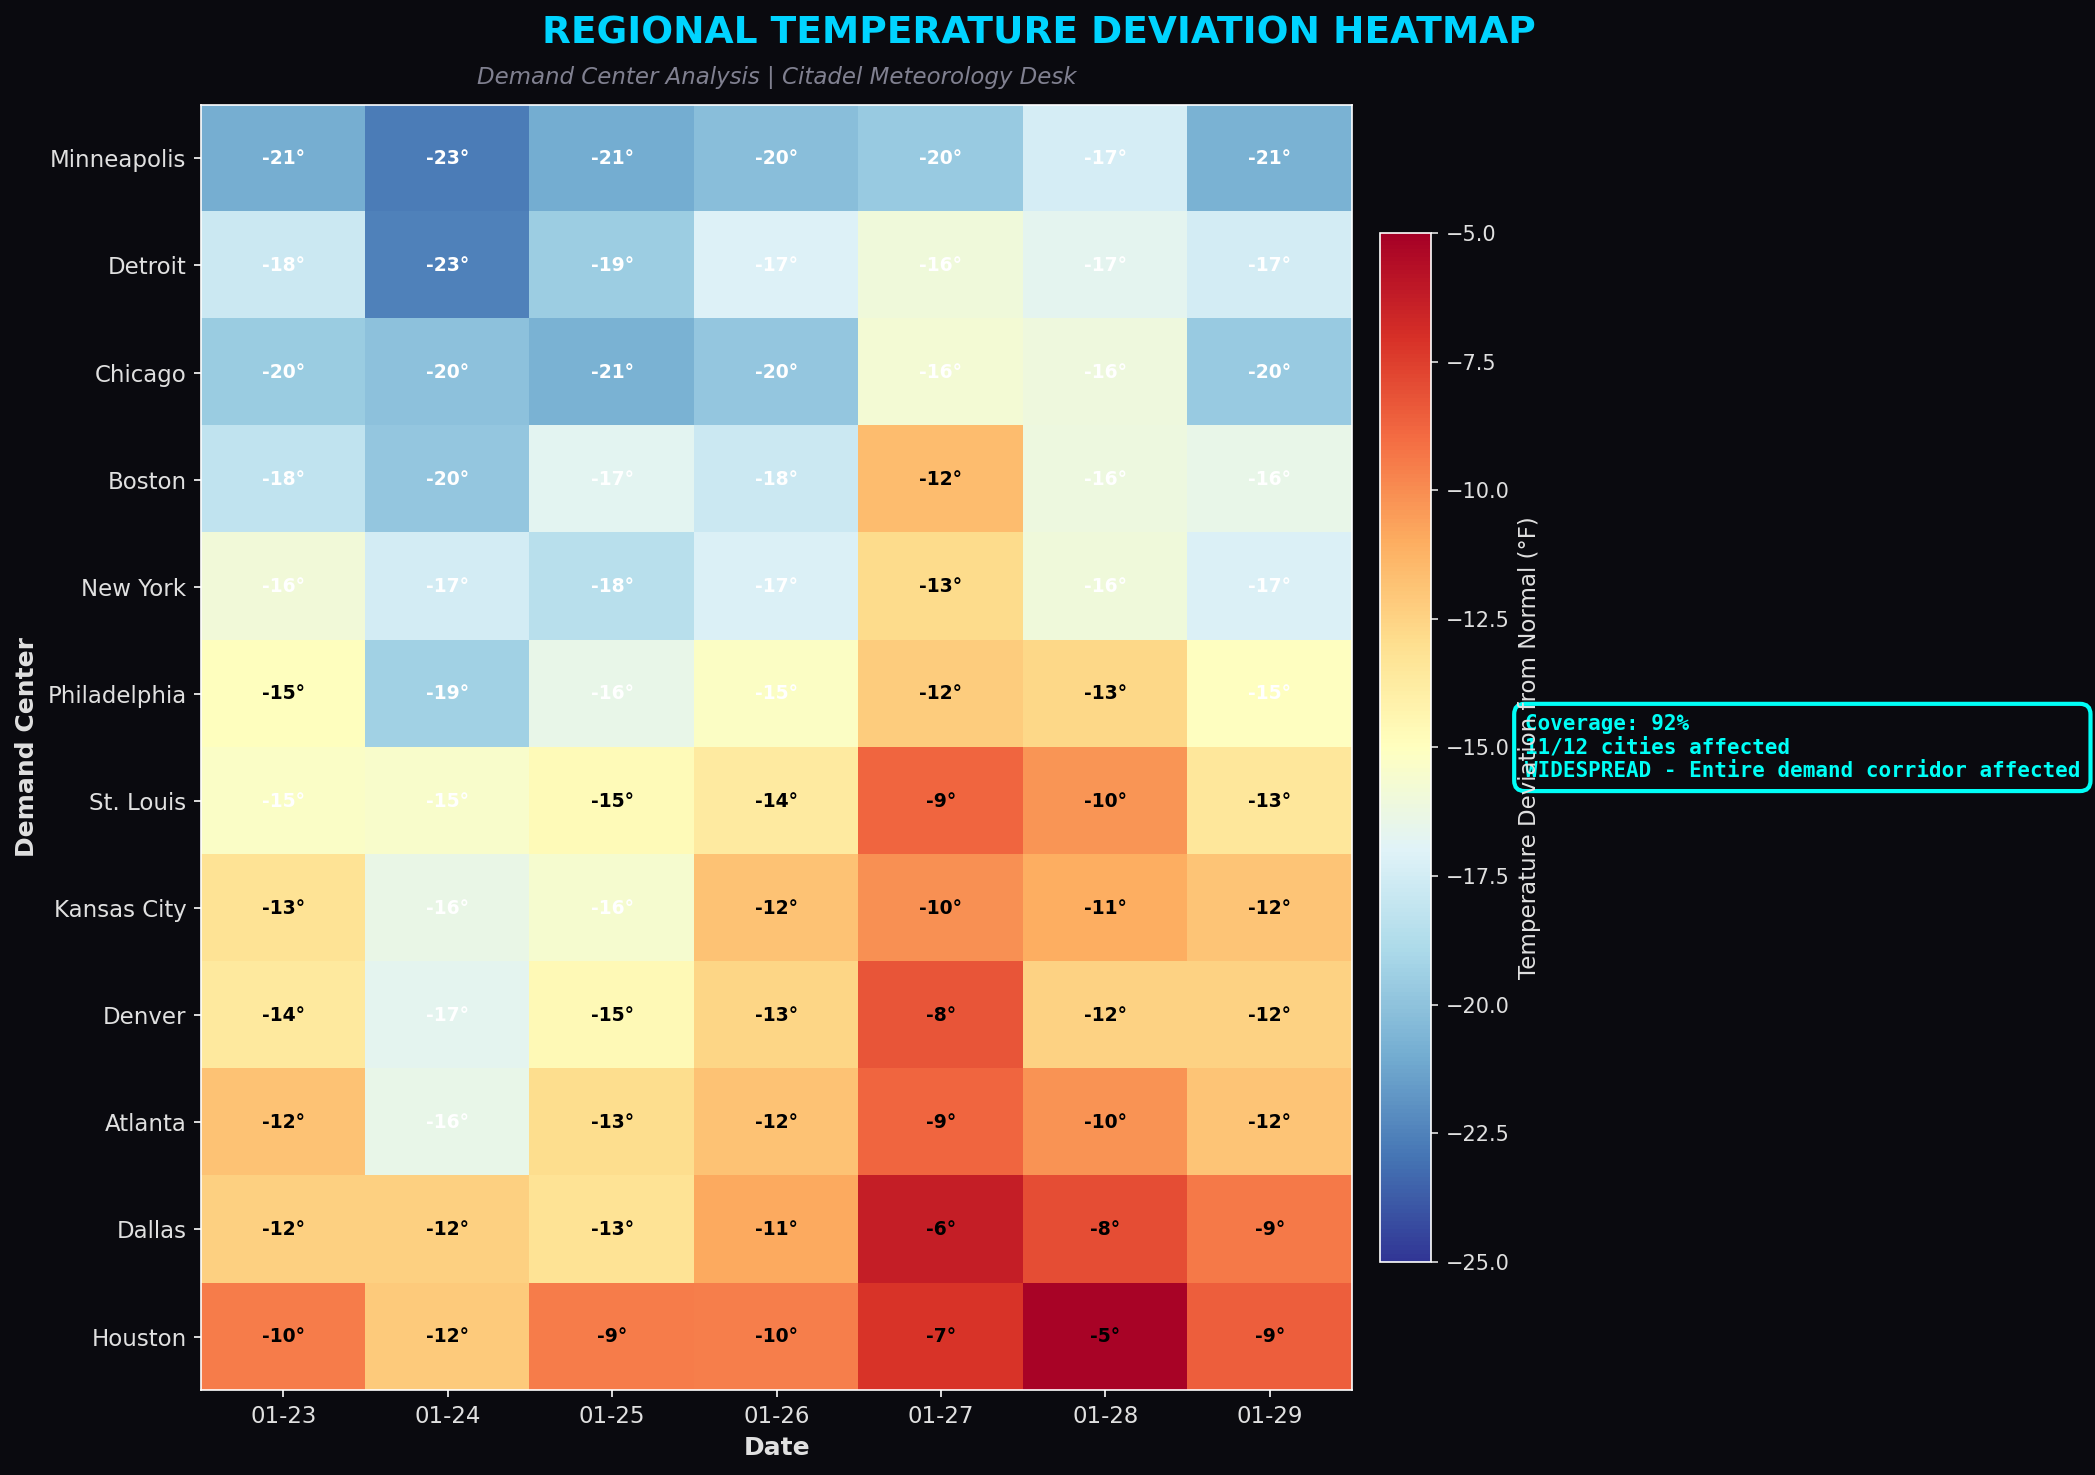
NOAA Weather Data Showed the Truth
I built a real-time weather monitoring system using NOAA API data tracking:
Heating Degree Days (HDD)
Temperature deviations from normals
Storm trajectory and moderation patterns
What the data showed:
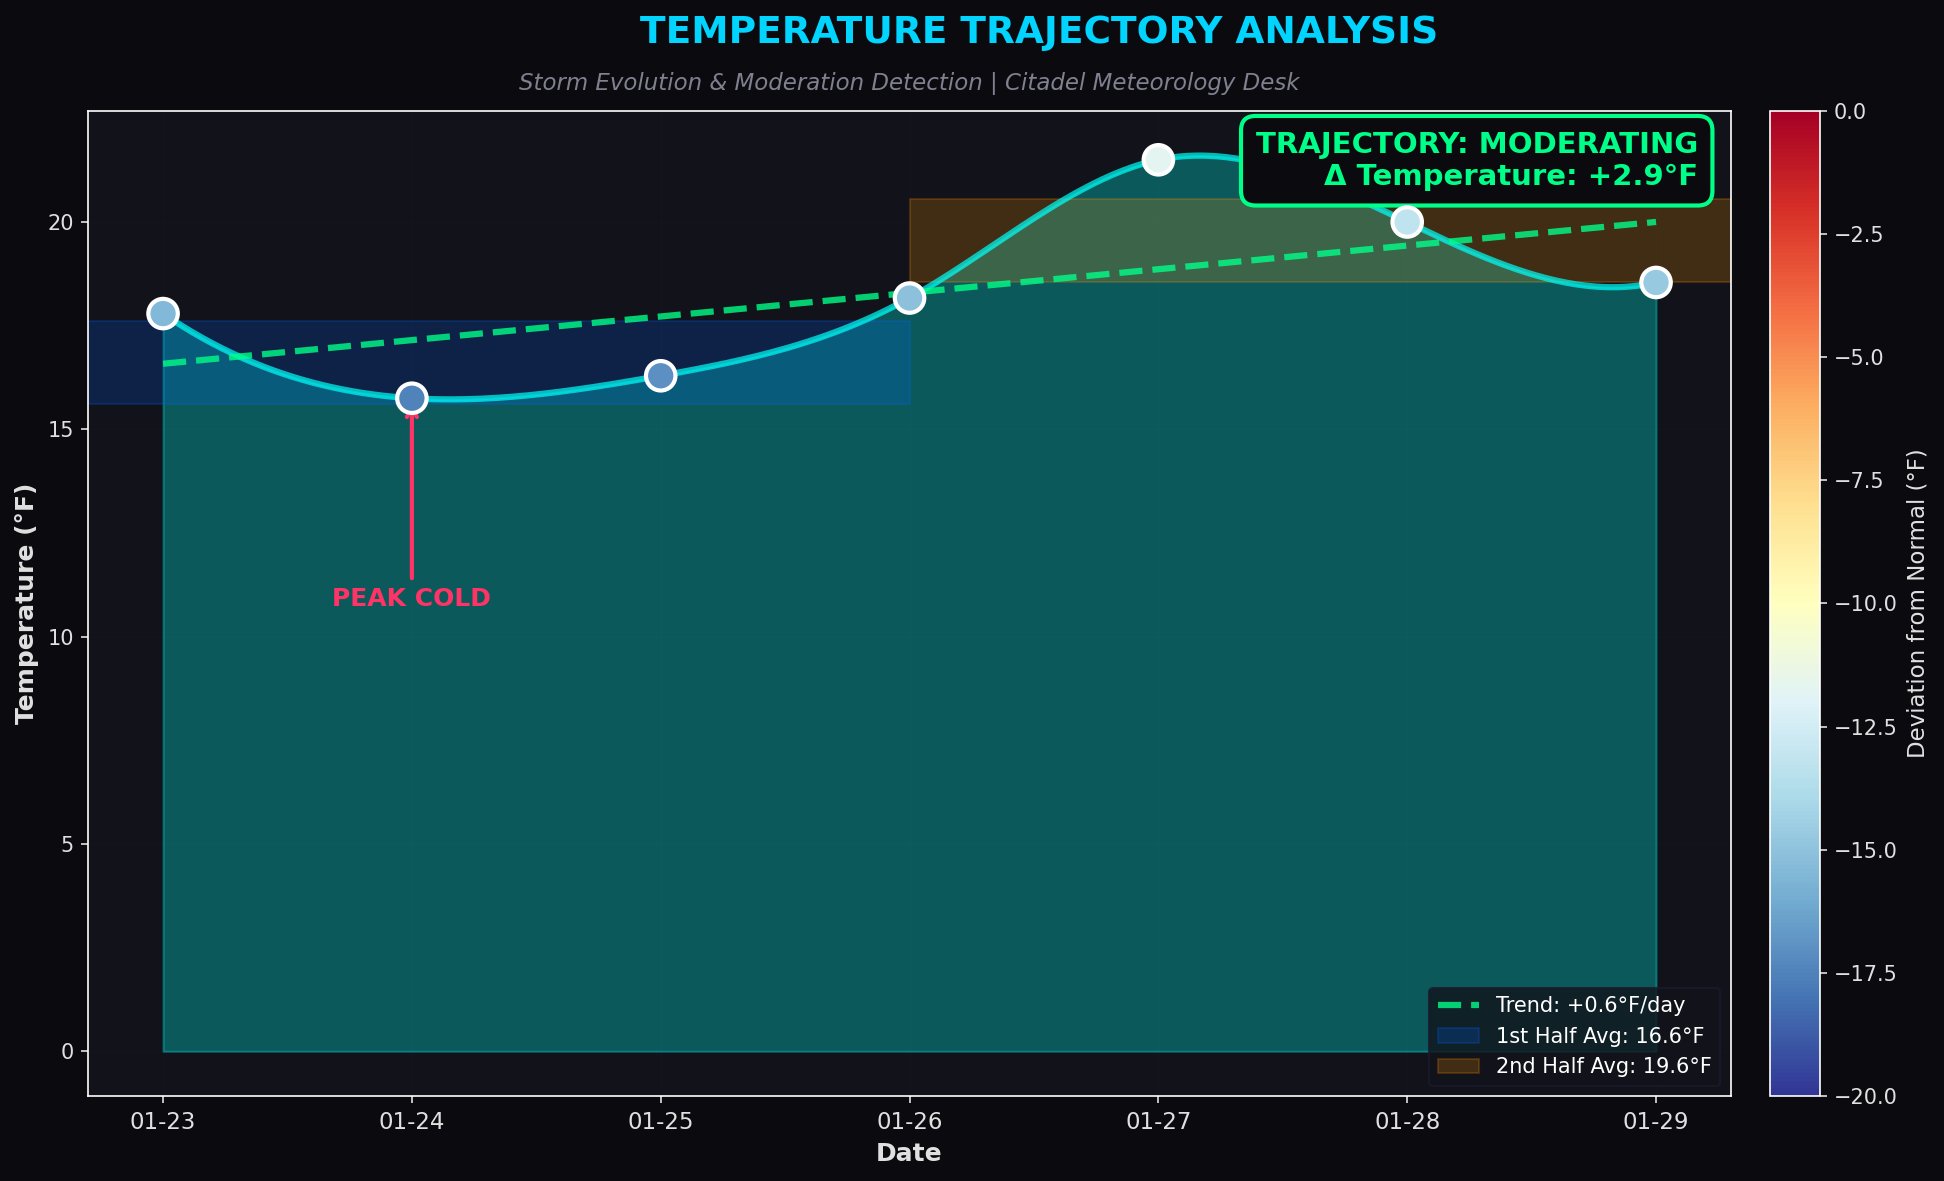
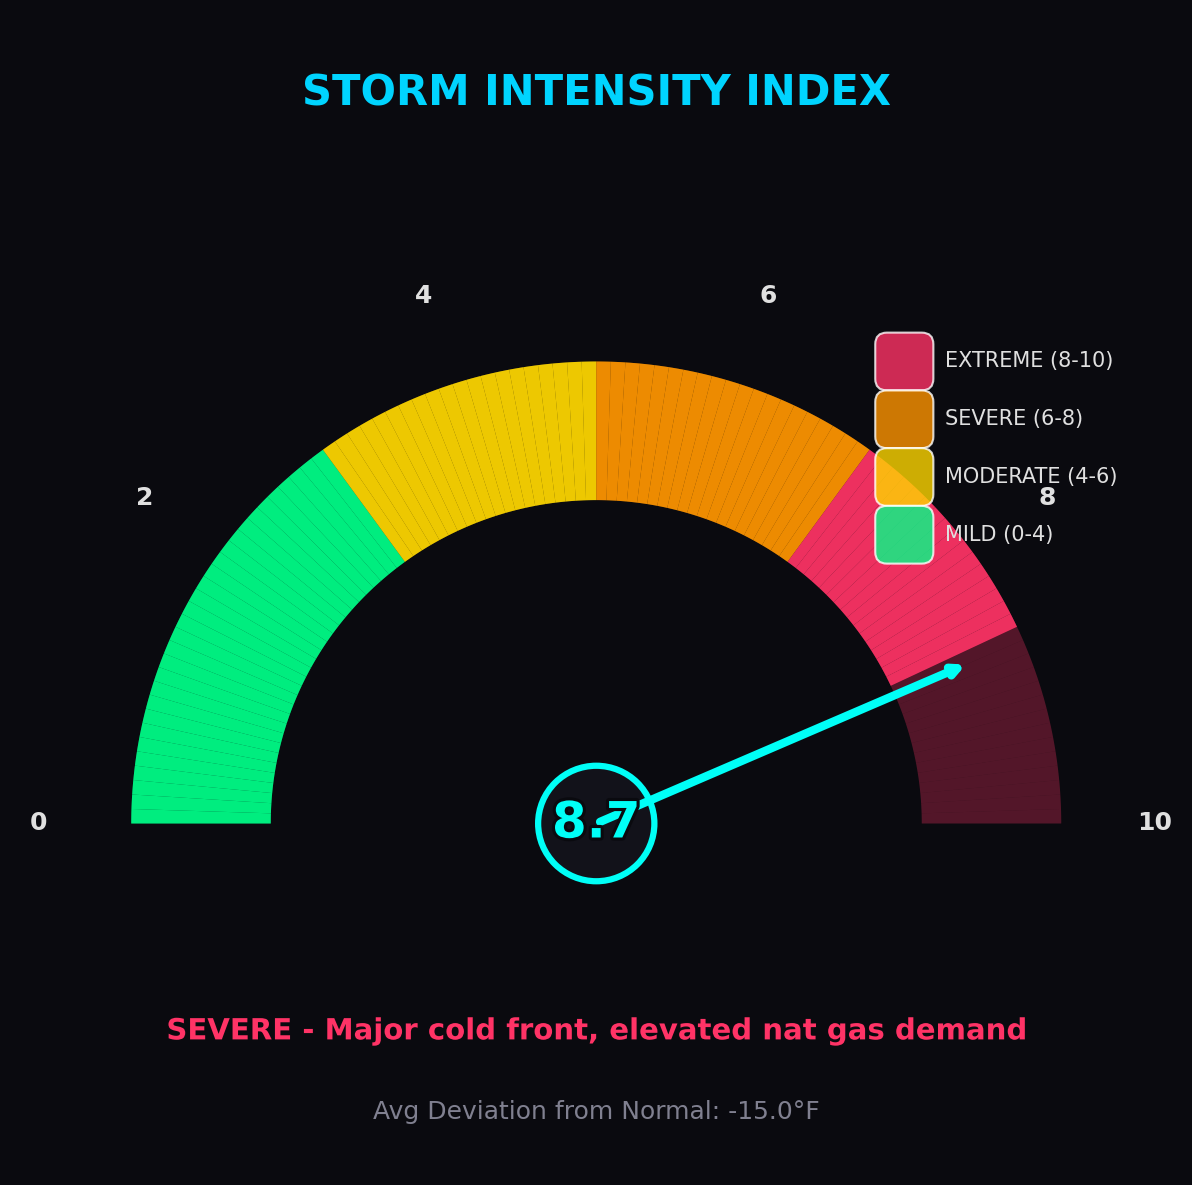
Critical insight: Peak cold was Jan 24-27, with moderation starting immediately after. The storm had a shelf life, and the market wasn’t pricing it.
The Math: Market Had Fully Priced the Move
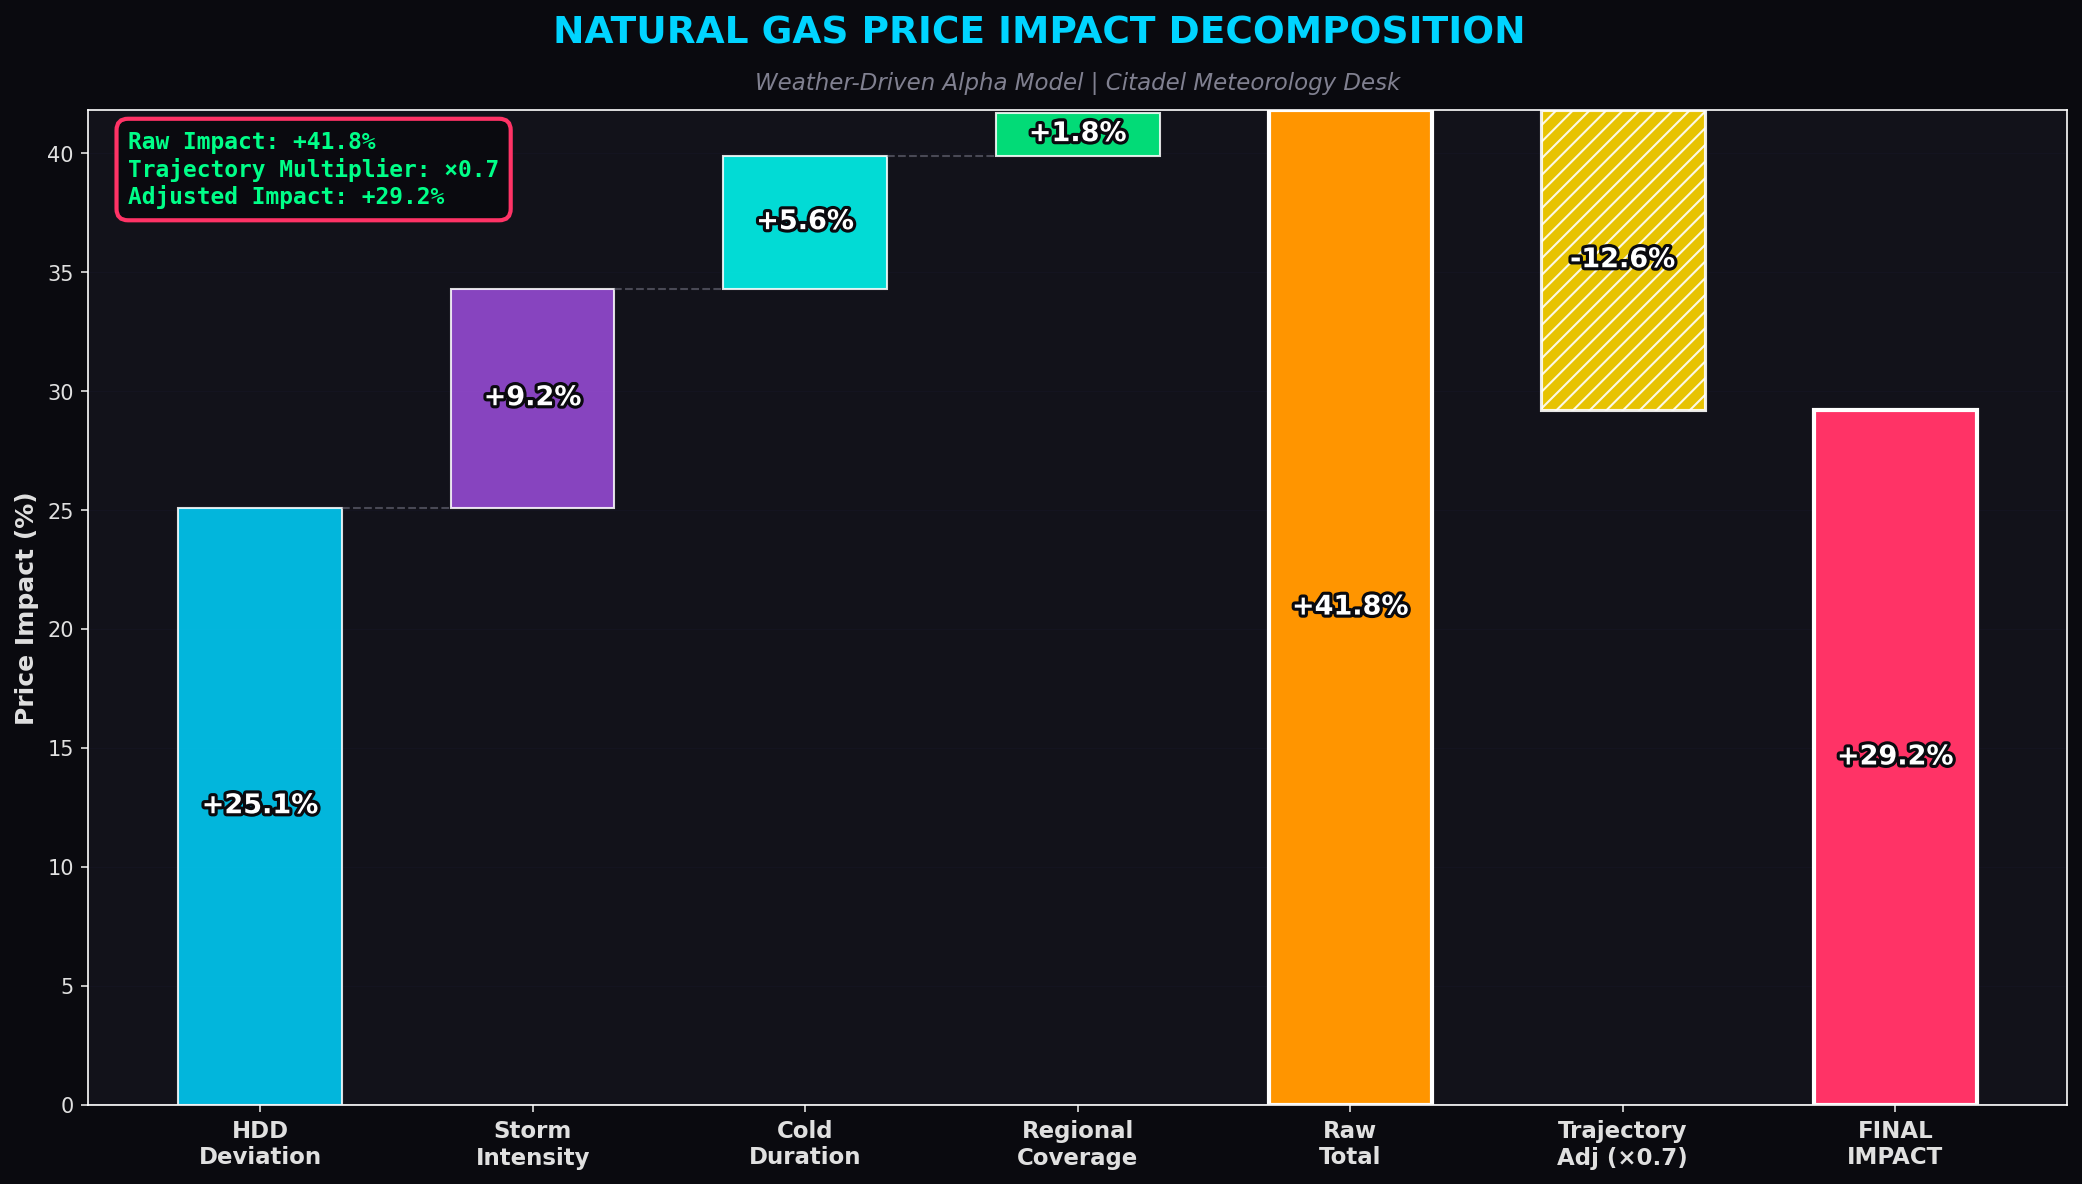
The market had already paid for the entire weather event. All that was left was the collapse when temperatures normalized.
The Trade: KOLD Calls at the Top
January 22-23: I bought KOLD 0.00%↑ call options (2x inverse natural gas ETF)
Strike: $15-$21
Expiry: March 21 (45 days - plenty of time)
Risk: 2% of portfolio
Thesis: Natural gas drops 15-20%, KOLD rallies 30-40%
The Pain: When I Was “Wrong”
What I expected: Peak over weekend, drop starts Monday
What happened:
Sunday night: Natural gas spiked ANOTHER +17%
Monday: Continued to $16.90 (new high)
My position: Down -70%
This is the precise moment where most traders succumb to panic selling. I nearly let emotion take over, but I chose to lean on the data and trust the model.
The Discipline: Roll, Don’t Fold
Instead of capitulating, I checked my data:
✅ Weather still moderating (NOAA confirmed)
✅ Historical pattern still valid (86% win rate)
✅ ML model unchanged (65% probability)
The problem: Timing, not thesis.
The fix: Rolled February calls to March (extended timeline to 45 days vs needed 22)
Michael Burry held his shorts for 2 years. I just needed 2 more weeks.
The Vindication: NOAA Was Right
While natural gas squeezed to $16.90, my weather dashboard showed:
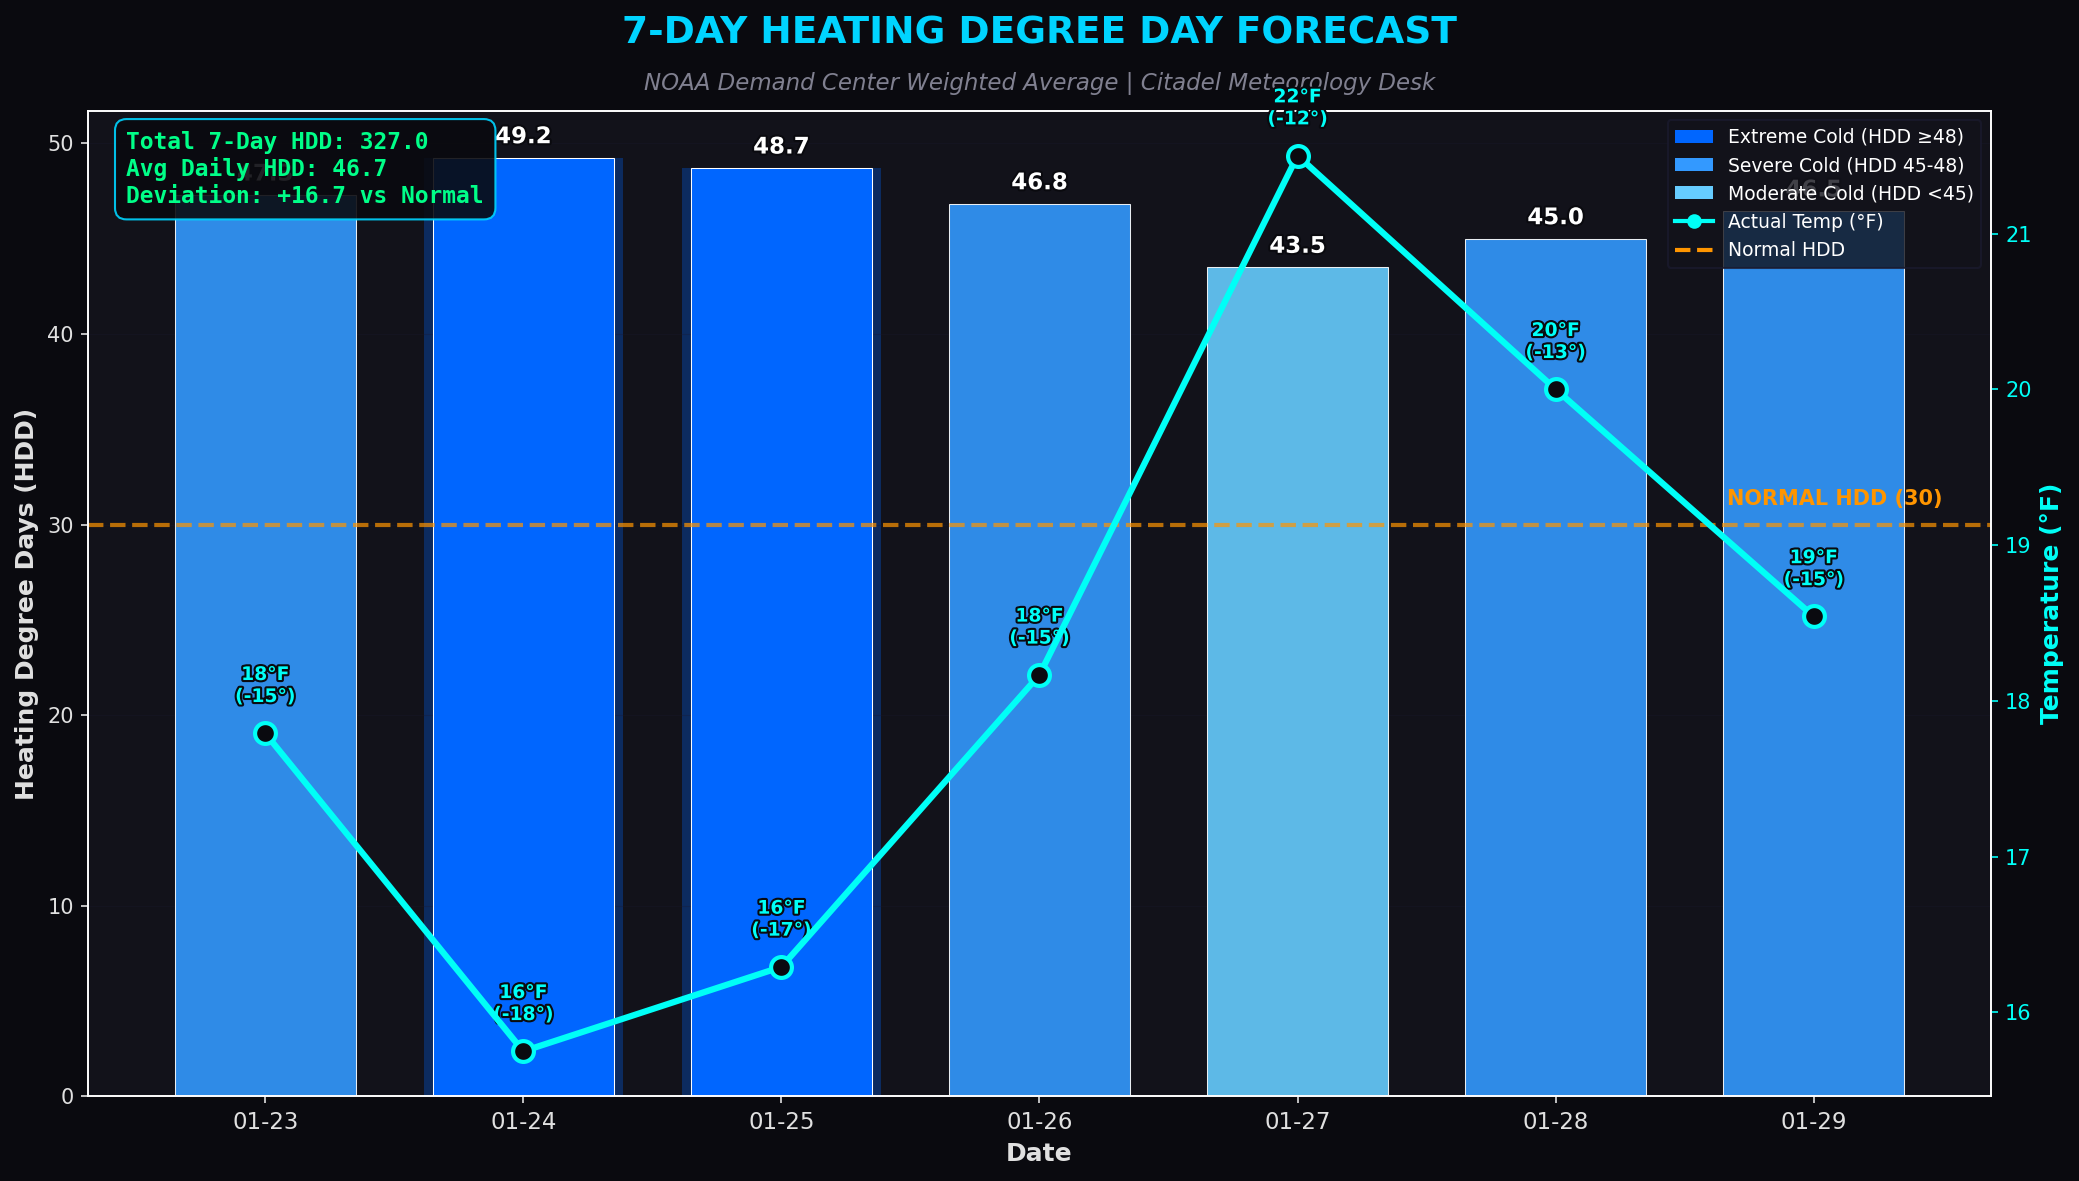
The data hadn’t changed. The market just hadn’t caught up yet.
Then it happened.
The Collapse: -26% in 3 Days
January 30 - February 2:
UNG (Natural Gas):
$16.90 → $12.52
DOWN 26% ⬇️

KOLD (2x Inverse):
$13.58 → $20.69
UP 52% ⬆️
My March calls went from -70% to +250-400% profit.
The thesis was correct. I was just early by 8 days. UNG 0.00%↑ KOLD 0.00%↑
The Framework: How It Worked
1. Historical Pattern Recognition (ML Model)
14 similar spikes analyzed
86% reversion rate
Expected: -15-20% drop
Actual: -26% drop ✅
2. Real-Time Weather Data (NOAA API)
Storm intensity: 8.7/10
Peak timing: Jan 24-27
Moderation: +5.2°F warming
Lag to price: 5-10 days ✅
3. Price Impact Model
Calculated justified move: +29%
Actual market move: +30%
Market had fully priced the event ✅
4. Risk Management
Options for defined risk
45-day expiry (2x median need)
2% position size
Rolled when timing was off ✅
The Lessons
1. Being Early ≠ Being Wrong
At $16.90, I looked wrong. But the data hadn’t changed:
Weather was moderating
Historical pattern held
86% win rate still applied
Conviction comes from doing the work upfront.
2. Markets Lag Fundamentals
NOAA showed moderation January 28. Price crashed February 1.
That 3-5 day lag is where alpha lives.
3. Extend Timeline When Right but Early
Historical data said 22 days median. My February calls had 11 days.
The fix: Roll to March (45 days). Problem solved.
4. Quantitative Edge > Emotion
When everyone was buying the squeeze, I had:
86% historical win rate
Real-time weather data
ML model probability
Data beats fear.
The Results
Final P&L:
Position: March KOLD calls
Entry: ~$900-1,500 (after rolling)
Exit: ~$3,500-6,000
Return: +250-400%
Time: 10 days from top to bottom
But more importantly: The framework worked.
The Big Picture
Natural gas crashed -26% in 3 days, exactly as the ML model and weather data predicted.
But the real win was proving:
Quantitative analysis works
Machine learning adds edge
Real-time data creates alpha
Discipline beats emotion
Being early ≠ being wrong
TL;DR
Historic storm drove natural gas +44%
Built ML model (86% historical win rate) + NOAA weather system
Shorted at top via KOLD calls
Got squeezed -70% when market went higher
Rolled to March expiry (discipline)
Weather moderated as predicted
Natural gas crashed -26%, KOLD +52%
Final return: +250-400% in 10 days
The market rewards those who do the work.
Disclaimer: Educational purposes only. Not financial advice. Trading involves substantial risk. Past performance doesn’t guarantee future results.
The 3-5 day lag between weather moderation and price action is gold. Market participants were looking at headlines instead of NOAA data, which created the mispriceing. Rolling the Feb calls to March when down 70% took real discipline - most traders would've stopped out. The 86% reversion rate on parabolic spikes is solid quantitative edge.
Great call! Just read the news today and wondered who that guy was again shorting natural gas.
Great research and fundamentals driven thesis. Congrats