
The Wage Trade: Why the 2026 Midterms Are More Mispriced Than You Think
Apollo just published two charts that the prediction markets haven't priced. Here's where the alpha is.

Let me start with a hypothesis: the 2026 midterm prediction markets are being priced like a national election. They should be priced like a labor economics story.
Two charts came across my feed this morning from Apollo Chief Economist Torsten Slok — and together they tell one of the cleaner second-derivative macro stories I’ve seen in a while. The market hasn’t caught up yet.
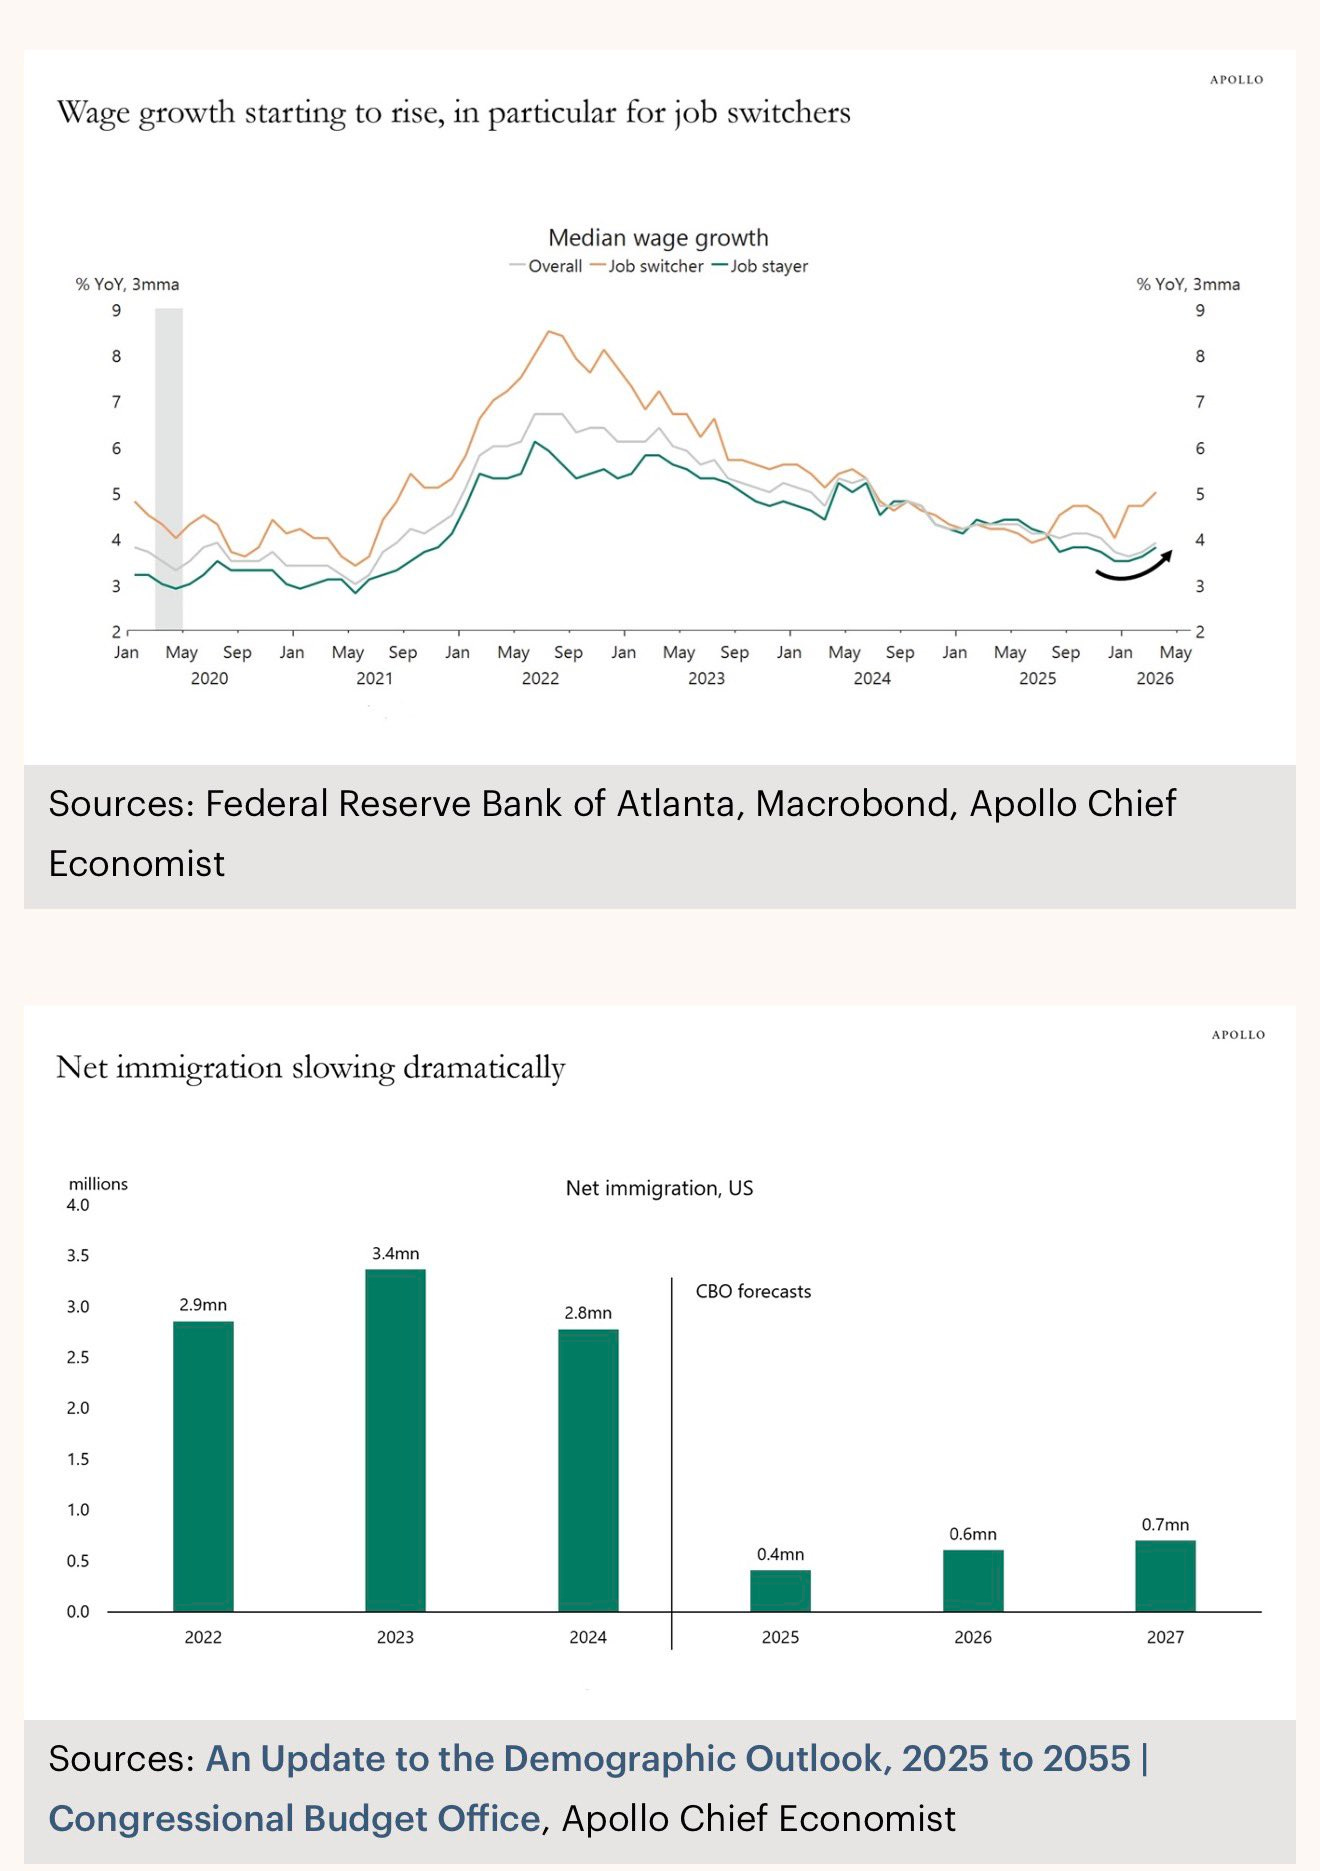
Chart one: median wage growth is bending back up. After cooling from the post-COVID peak, the job-switcher series — historically the leading indicator for broader wage moves — is re-accelerating into early 2026. Chart two: net immigration has collapsed from 2.8 million in 2024 to a CBO-projected 0.4 million in 2025, recovering only modestly to 0.6–0.7 million through 2027.
Put them together and the story is simple: a labor supply shock is tightening the market in exactly the sectors that relied most on immigrant workers. Native-born workers in construction, agriculture, meatpacking, and hospitality are starting to see real wage gains. And those workers vote.
“The market is pricing the generic ballot. The pocketbook voter is pricing their paycheck.”
The Political Transmission Mechanism
Pocketbook voting is one of the most robust findings in political science. When real wages rise visibly, the incumbent party benefits. Reagan ‘84, Clinton ‘96, the 2019 low-income wage surge all confirm it. The question isn’t whether the mechanism exists — it’s whether the wage acceleration is large enough, fast enough, and felt by the right voters to shift the outcome in swing districts.
The Slok data suggests the answer is yes on all three. The job-switcher series is your early signal — it moves first, stayers follow with a 3–6 month lag. We are currently in that lag window. By September and October, when early voting starts, the wage improvement will be visible in paychecks across the states that matter most.
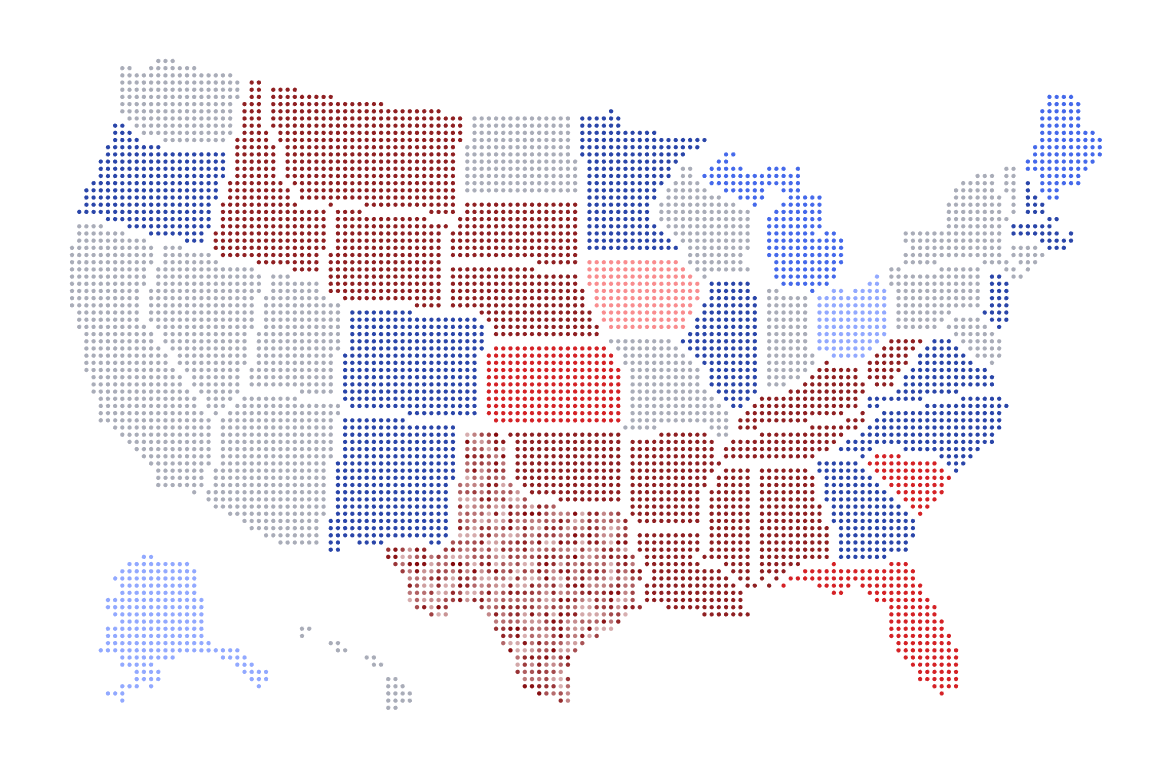
The critical variable the prediction markets are missing: this isn’t a national story. It’s a state-specific labor market story. And some states are dramatically more exposed than others.
The State-by-State Mispricing Map
If you're interested in trading any of these markets, consider using my referral link to sign up for Polymarket → it helps support independent research like this. 🔗
https://polymarket.com/?r=Kairos7
Texas Senate
This is the most egregious single misprice on the board. Texas has one of the highest concentrations of immigrant labor in construction, oil field services, and agriculture in the country. An 86% collapse in net immigration hits Texas working-class voters hardest and most visibly — and the wage uplift in those sectors will be felt first.
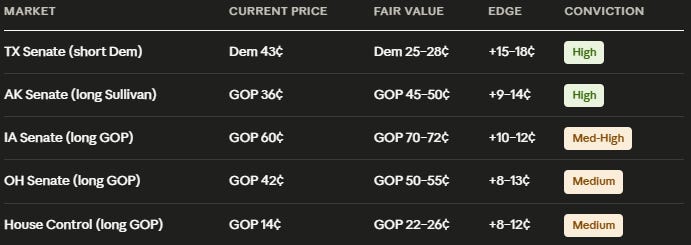
Democrats are currently priced at 43 cents to win the Texas Senate race. Democrats have not won a Texas statewide race since 1994. Thirty years. I have this as 25–28 cents fair value at most. That’s a 15–18 cent mispricing on a $183K volume market — liquid enough to size a real position.
Iowa Senate
Iowa is ground zero for this thesis. Meatpacking and agricultural processing dominate the Iowa interior — Tyson, JBS, and similar facilities employed enormous immigrant workforces. With immigration collapsed, native-born wage pressure in those plants is real, immediate, and politically legible to the voters who work there.
GOP is currently priced at 60 cents. I have fair value at 70–72 cents. The market is underpricing rural Iowa’s sensitivity to exactly the labor dynamic the Slok charts describe. Buy the Republican Iowa Senate position.
Alaska Senate — Mary Peltola vs. Dan Sullivan
This is the cleanest individual race mispricing on the board. Peltola is priced at 64 cents — Sullivan at 36 cents — in a state Trump won by 13+ points in 2024. The market is giving significant RCV incumbency premium to Peltola, but Alaska’s fishing and resource extraction industries are not insulated from the labor dynamics in play.
More importantly: Alaska at 64% Democrat in the current political environment is simply wrong on priors alone. I have Sullivan at 45–50 cents fair value. That’s a 9–14 cent edge on the highest-volume individual Senate race on the page ($306K).
Ohio Senate
Ohio is the interesting swing case. Manufacturing and construction workforce with meaningful immigrant labor overlap, in a state Trump won by 11 points in 2024. Democrats are priced at 58 cents here — a slight favorite. If the wage acceleration story plays out in the Ohio Rust Belt, this flips. Medium conviction, 8–10 cent edge toward GOP.
The Full Alpha Stack
What Kills This Trade
Two things break the thesis and you should watch both closely.
First: tariff-driven goods inflation. The April 2026 tariff regime on steel, autos, and broad consumer goods could re-ignite inflation and compress real wage gains back toward zero. Nominal wages up 4% plus goods prices up 3% equals a real gain of roughly 1% — which voters don’t feel. Watch the April CPI print (May release) as a pivot point. If goods prices reaccelerate, the Slok thesis weakens as a political argument.
Second: sector-specific unemployment. The immigration collapse has two sides. Tighter labor supply pushes wages up, but it also slows hiring in construction and agriculture. If regional unemployment spikes in immigrant-dependent sectors — Texas homebuilding stalls, Florida agriculture contracts — the job loss narrative will dominate the wage gain narrative in local media and voter sentiment.
The Data to Watch:
Atlanta Fed Wage Growth Tracker (monthly), BLS JOLTS job openings in construction + leisure/hospitality, generic ballot by state (not national), and April CPI goods ex-food/energy. When the generic ballot in Texas or Iowa tightens toward Dem +2 or better, that's the signal the market is repricing — and your position is moving.
The prediction markets are running a national model on what is fundamentally a disaggregated labor story. The crowd is pricing the generic ballot from three months ago. The edge is in being early on the second derivative — the rate of change in real wages for the workers in the states where the immigration-to-wage transmission is fastest.
The market will be the last to know. That’s where the alpha is.
Disclaimer: Not financial advice. Prediction market positions involve real capital at risk. All probabilities are the author’s own estimates and may be wrong. Do your own research.