
The Housing Inflection Nobody Sees
Catching the Third Derivative Before Wall Street Wakes Up

“The chart generates the idea, then you go find the story.” — Stanley Druckenmiller
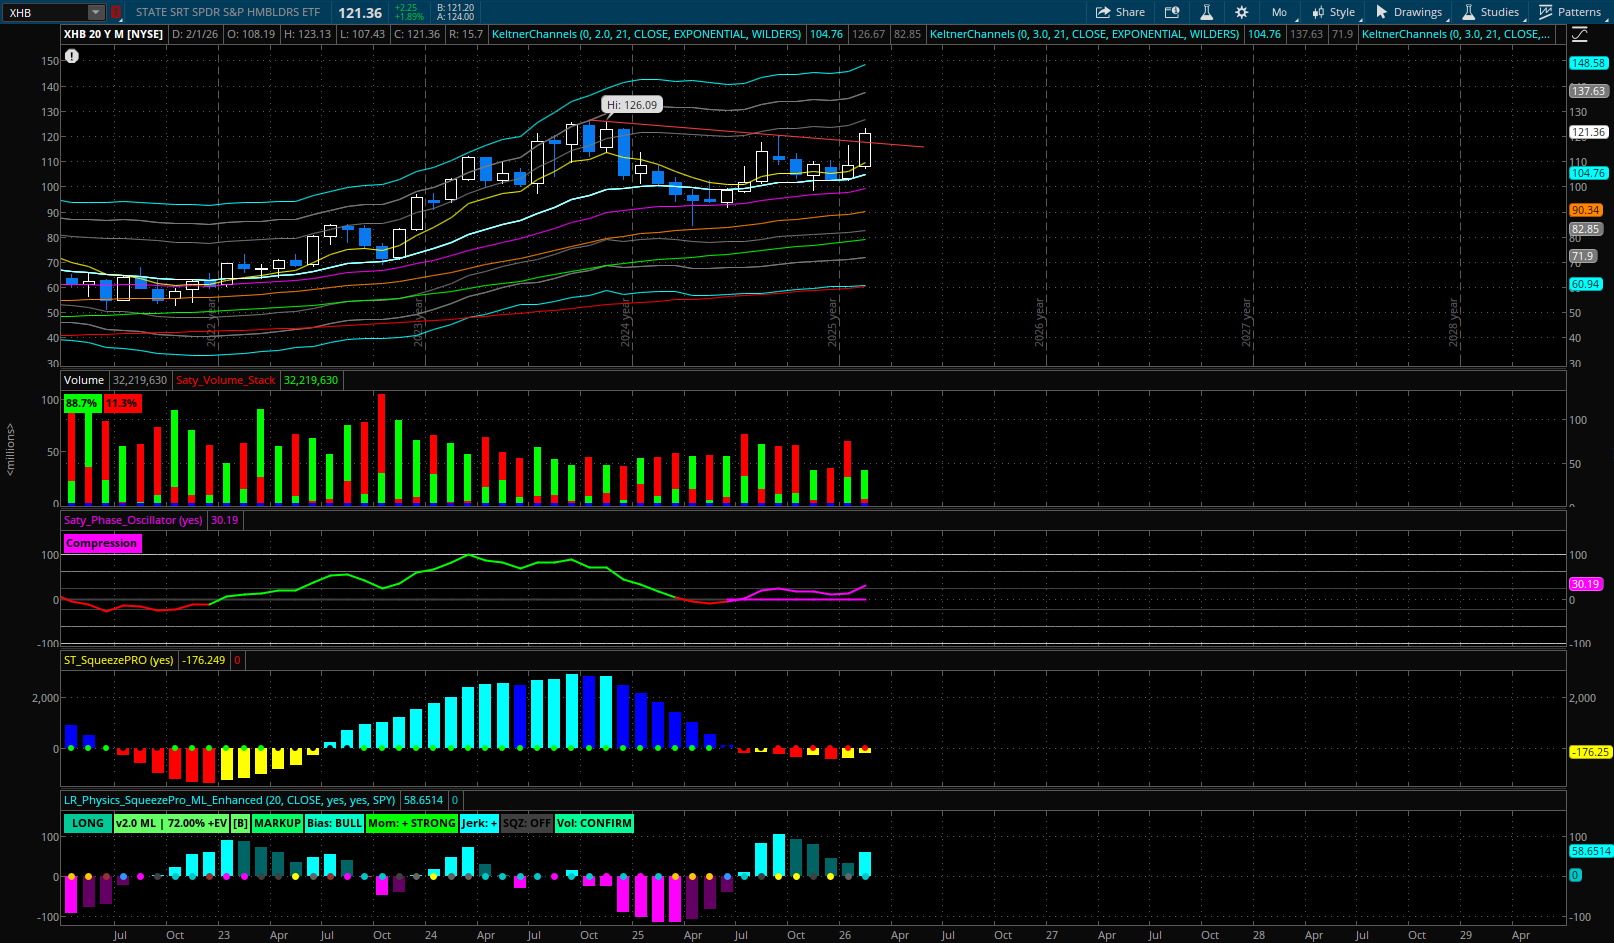
That’s exactly what happened here. XHB’s monthly chart showed a textbook multi-year base breakout on massive volume. Chart screaming institutional accumulation. The physics were undeniable!
But when I lifted the hood on what’s actually moving this sector → when I dug into the earnings calls, the institutional flows, the second-order derivatives…
I found something Wall Street is completely missing:
The inflection is already here. It’s just hidden in plain sight!
What Everyone Thinks They Know
Turn on CNBC, and here’s the narrative:
Housing is dead → Affordability crisis, lock-in effect, 80% of mortgages below 6%
Tariffs will crush margins → Material costs exploding, builders getting squeezed
Consumer is paralyzed → Uncertainty about jobs, AI anxiety, nobody’s buying
Institutional buyers retreating → Build-to-rent collapse, policy restrictions killing demand
The result? Homebuilder stocks trading at 7-9x earnings like the world is ending.
But when you actually read the transcripts, pull the 13Fs, and analyze the derivatives...
The market color is completely wrong.
