

The next meaningful insight in the AI infrastructure trade may come from an old cluster signing a new contract.
Investors spend enormous amounts of time debating the next Nvidia architecture NVDA 0.00%↑, the next capacity announcement and the next financing package. The cash earned by hardware already installed deserves the same attention.
CoreWeave CRWV 0.00%↑ offers a concrete example. On its second-quarter earnings call, management disclosed an A100 contract extending into 2029. That architecture debuted in 2020. Management also described prior-generation pricing as at or above earlier levels. [1]
This is evidence of a market finding productive uses for older compute. It does not establish that every A100 has been running continuously since 2020, or that every cluster can generate attractive returns for nine years. But it challenges a blanket assumption that a new architecture rapidly eliminates the earning power of its predecessors.
My bullish interpretation is straightforward: profitable renewals can turn the installed fleet into a much longer stream of cash flows than a short obsolescence assumption allows. The stock implication depends on the price paid for that stream and the financing required to build it.
The evidence is becoming harder to dismiss
Nvidia’s October 1 blog organizes AI-factory returns around earning capacity, useful life and demand. Its emphasis on durability is particularly relevant: a system’s ability to serve different workloads can keep it commercially useful after a new generation ships. The company points to A100 bookings through 2029 as an example. [2]
Its September investor presentation adds another dimension. Using Silicon Data monthly residual-value estimates, Nvidia shows A100 at 25% of assumed original cost, H100 at 58% and B200 at 158%. The systems are different ages. The cost assumptions are $20,000, $35,000 and $45,000 per GPU respectively, on an eight-GPU HGX-system cost allocation. [3]
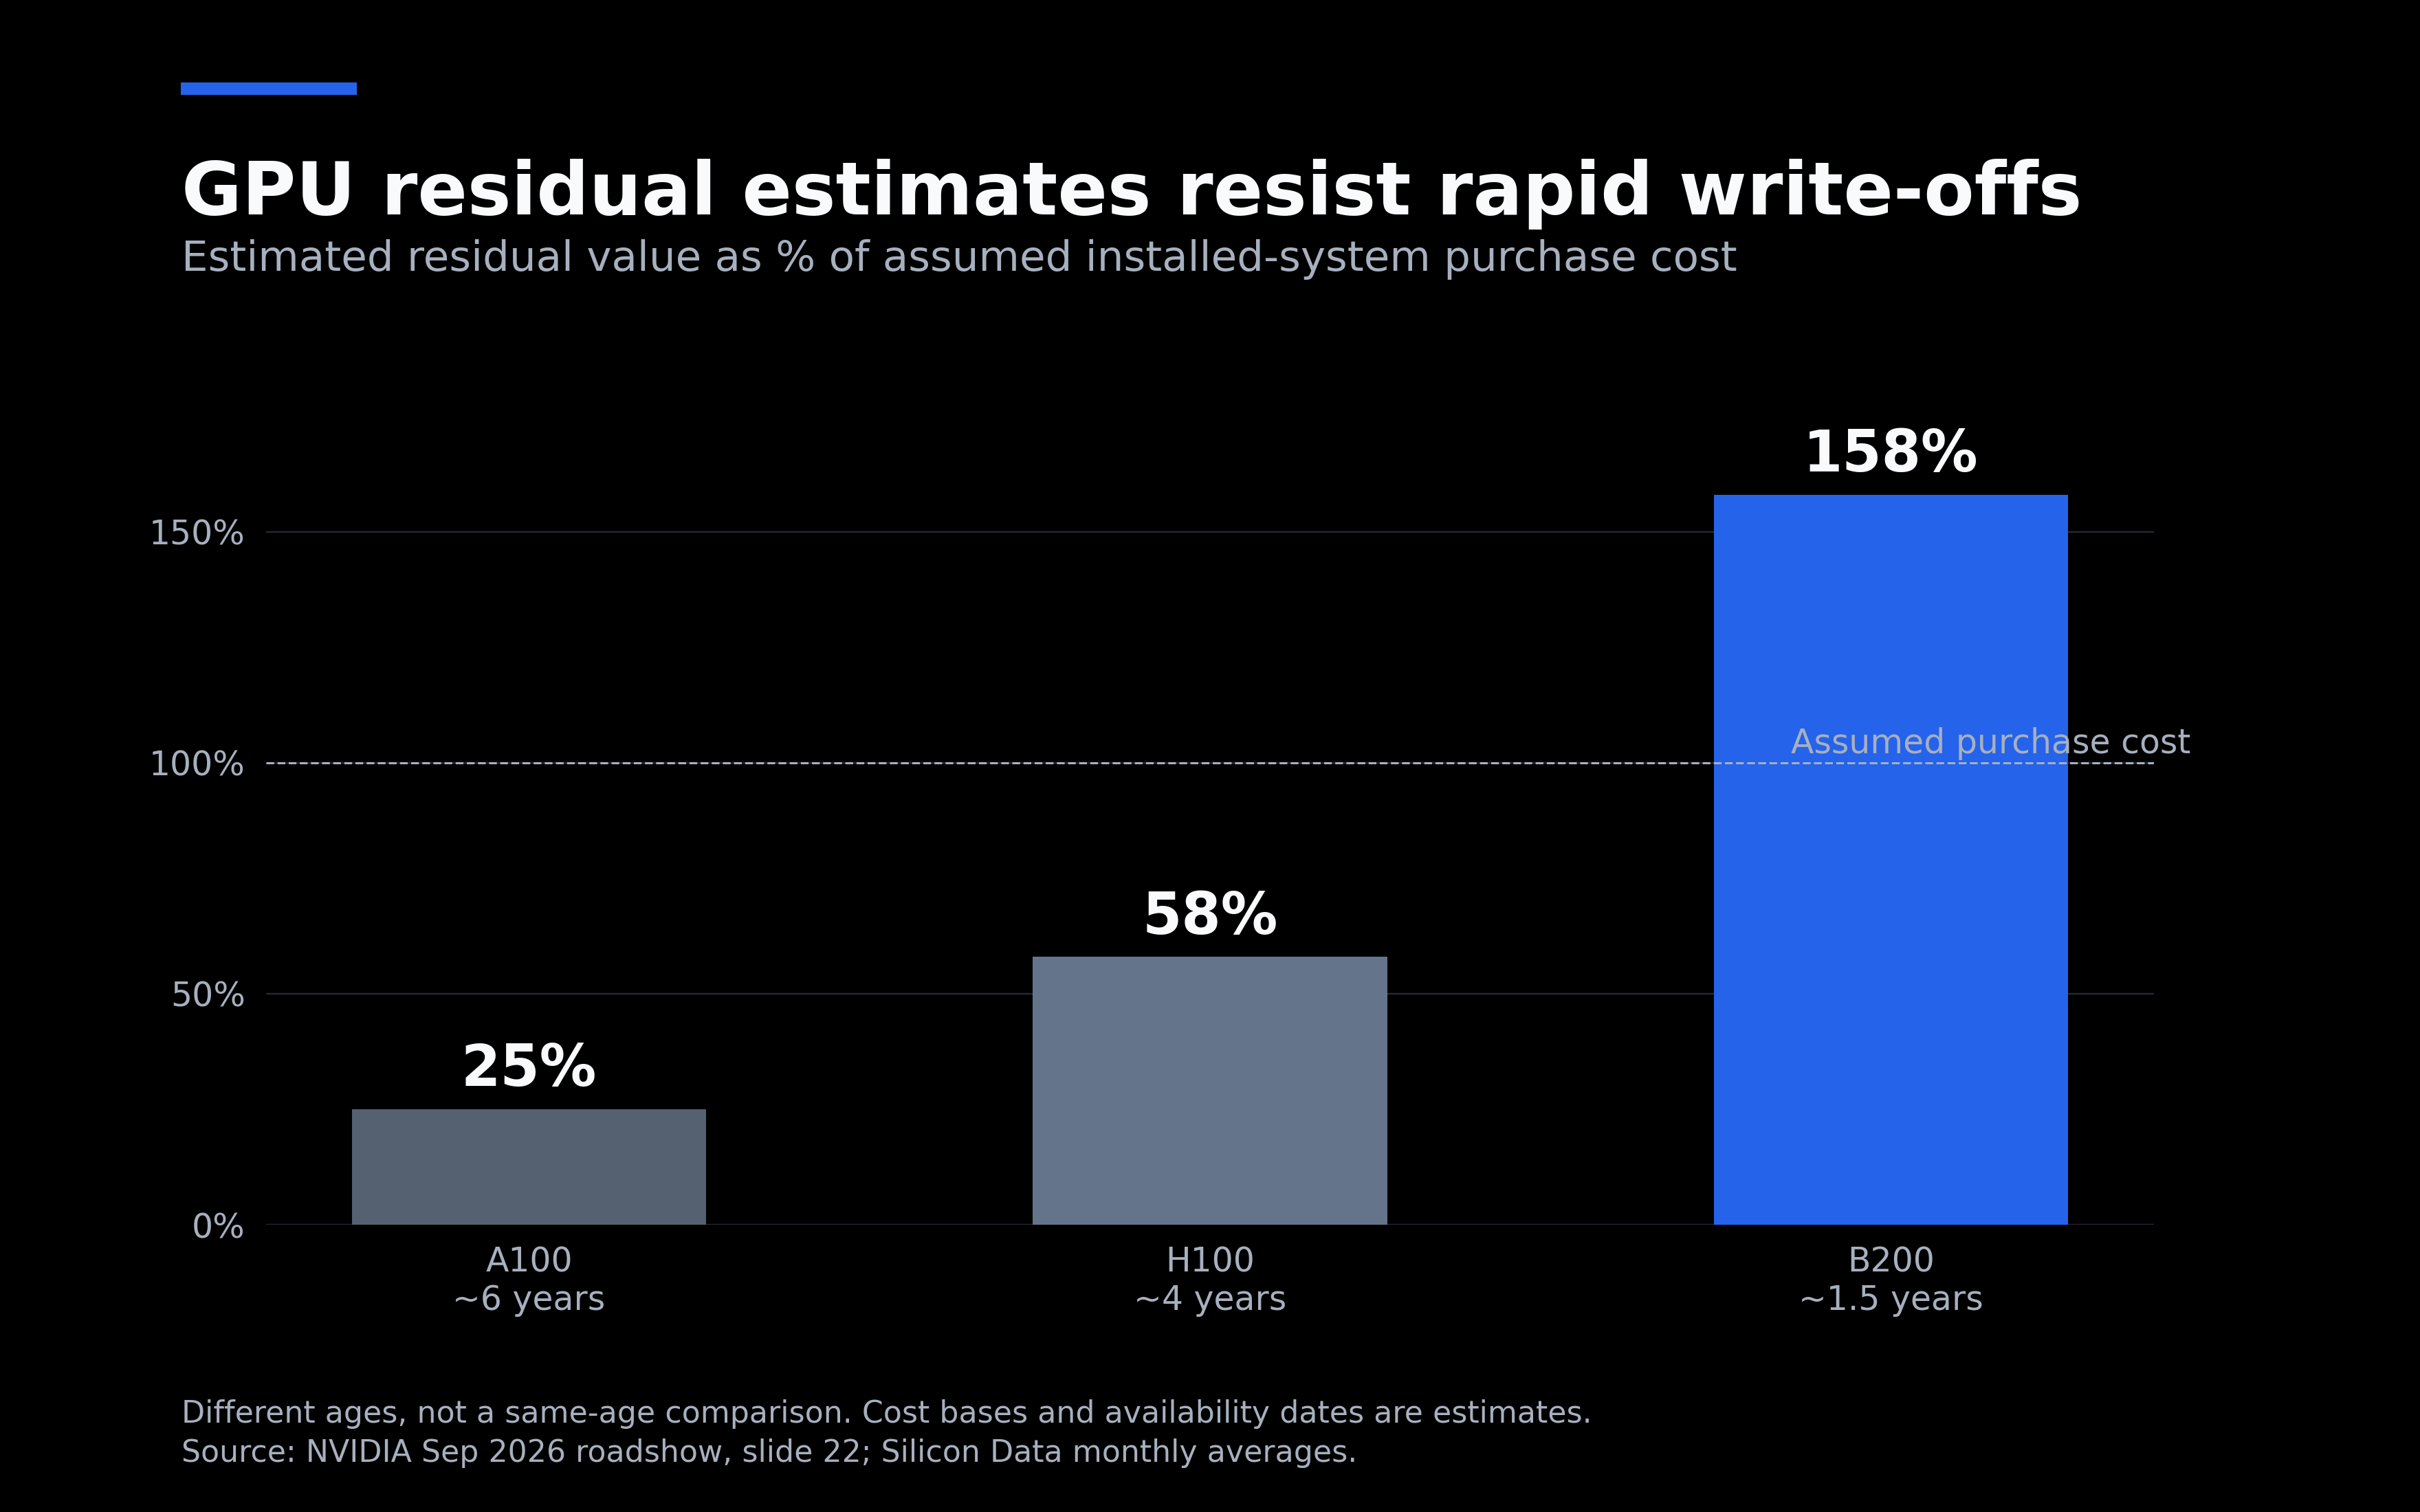
That changes the precision of the appreciation argument. For B200, the presentation supports an estimated value above assumed acquisition cost. For A100 and H100, the evidence supports substantial retained value. Those are different outcomes, and both matter.
The supplied a16z chart provides a separate look at rental earning power: its September endpoints are $1.59 per GPU-hour for A100, $2.63 for H100, $3.29 for H200 and $5.69 for B200. Its accompanying research describes resilience in older-generation rental pricing. [4]
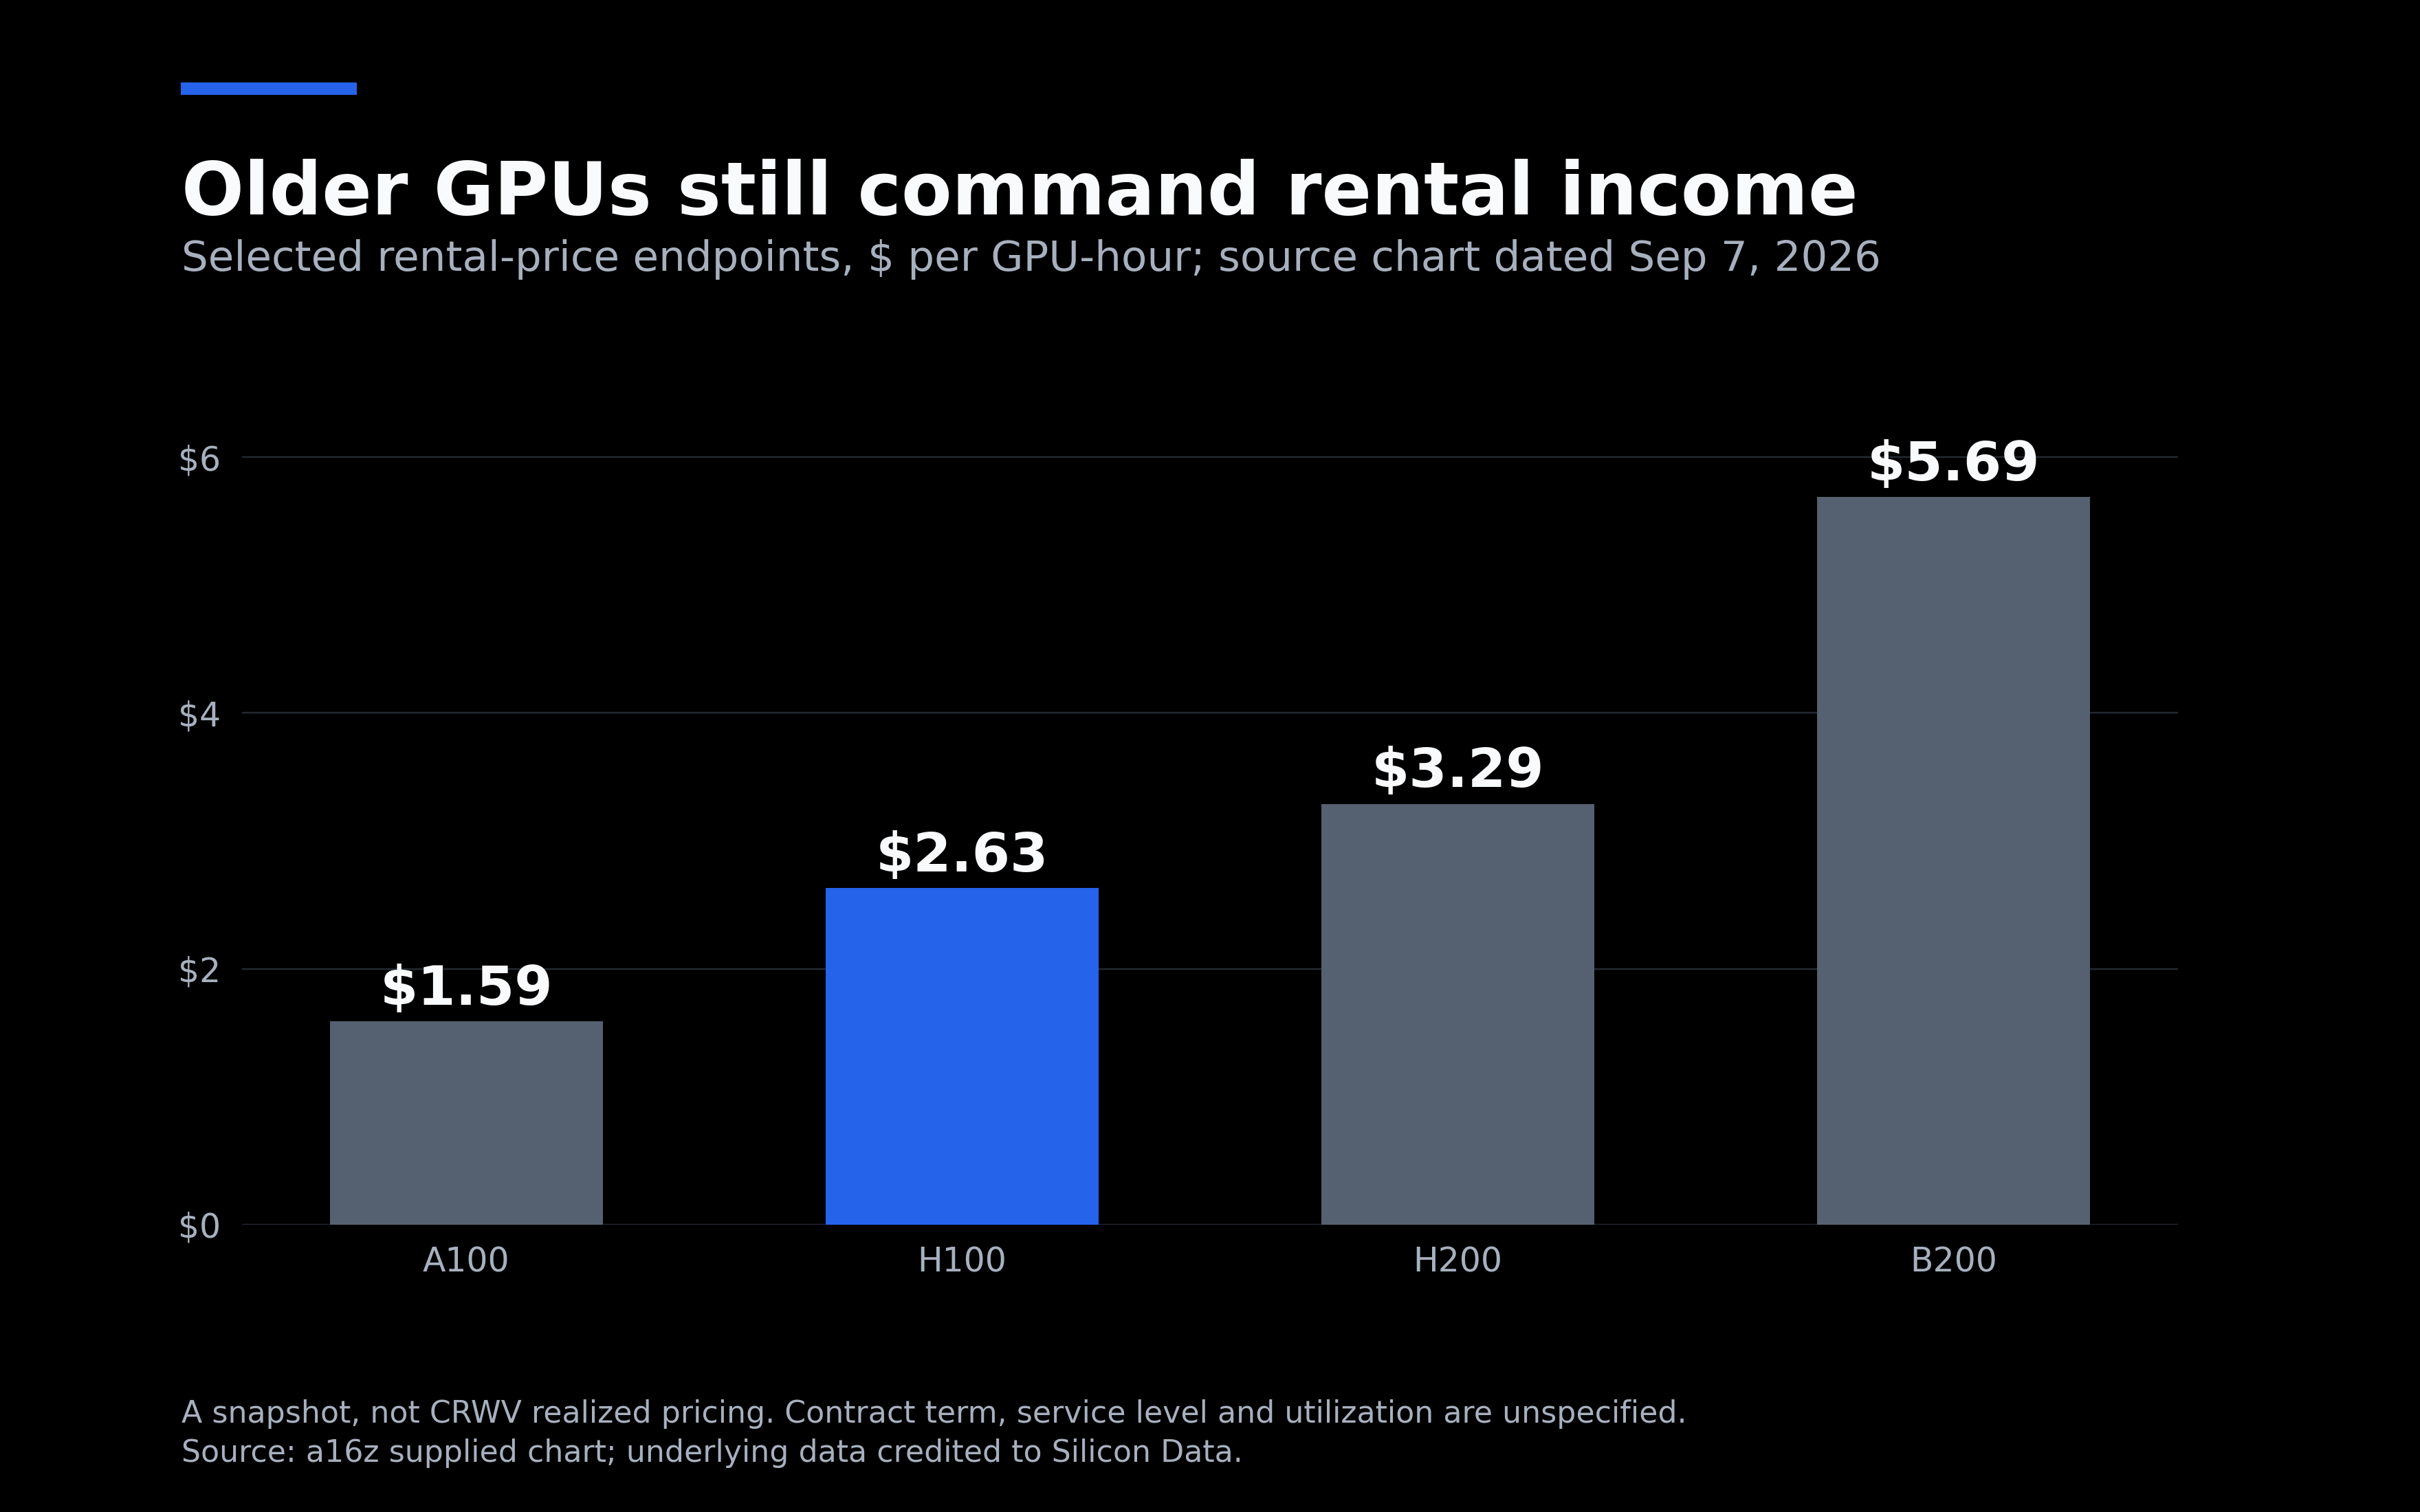
Rental rates help reveal what customers will pay to use an asset. Resale estimates help reveal what someone might pay to own it. Neither replaces the operating-cost and financing analysis needed to calculate shareholder returns.
The frontier moves; workloads spread across generations
On TBPN, Mike Intrator described getting “clubbed in the head” over obsolescence concerns and pointed to an “incredibly fat tail” of productive uses beyond frontier workloads. [7] His argument offers a useful way to think about this market. Frontier workloads place a premium on the latest systems. Other customers prioritize a familiar software stack, an existing deployment, availability or a lower total bill for a task with less demanding performance requirements.
The demand curve can therefore broaden across generations. An older cluster can keep serving useful work while a newer cluster expands what is possible at the frontier. That is the hypothesis underlying the durable-renewal case, not a claim that older hardware always offers better economics.
Nvidia’s software argument adds another potential source of durability: improvements to libraries and kernels can increase the usefulness of an installed system without replacing its silicon. [2] The investment inference is that hardware age alone may be an incomplete description of the asset’s earning capacity.
This is where the compute paradox becomes relevant. Falling cost per unit of intelligence can make additional applications economical. If that expands demand enough, multiple generations may remain commercially occupied. The evidence so far supports testing that possibility; it does not establish unlimited demand or permanently rising prices.
The economic value sits in the later contracts
The first contract has to justify the original investment. It must support operating costs and capital recovery, while the financing schedule determines how much cash is available to equity holders.
A subsequent contract can be valuable because it reuses equipment, network integration and an operational deployment. The original capex is already sunk. Continued service still requires maintenance, power, rent, support and sometimes incremental refurbishment—but it may avoid the large upfront expenditure associated with an entirely new cluster.
That creates a distinction investors should model explicitly:
Accounting depreciation allocates historical cost over an estimated useful life. Economic life describes how long an asset can earn attractive returns. Market value reflects what a buyer might pay today.
A longer depreciation schedule can raise reported earnings without creating operating cash. A longer profitable earning life adds future cash flows. Higher sale proceeds add value when the asset is actually disposed of. A sound model keeps these effects separate.
The depreciation chart also requires nuance. Operators have extended useful-life estimates over time, but those estimates do not move in only one direction. Amazon shortened the life of a subset of servers and networking equipment from six years to five beginning in 2025, citing faster technological development. [5] Broad server schedules are useful context, not a universal GPU-lifetime rule.
What two additional earning years are worth
To isolate the lifetime effect, I held the other assumptions constant in an illustrative project model:
$40,000 of initial installed cost per representative GPU-equivalent.
$3.26 per billed GPU-hour and an 85% commercial billing factor.
Identical pricing for the first three years, followed by a 5% first-renewal reduction and 5% annual reductions thereafter.
A 63% cash operating margin, $1,000 of first-year maintenance growing 3% annually, and explicit cash taxes.
A six-year straight-line tax-depreciation proxy, 5% terminal resale and a 12% unlevered discount rate.
These are analyst assumptions, not disclosed CoreWeave unit economics. [6]
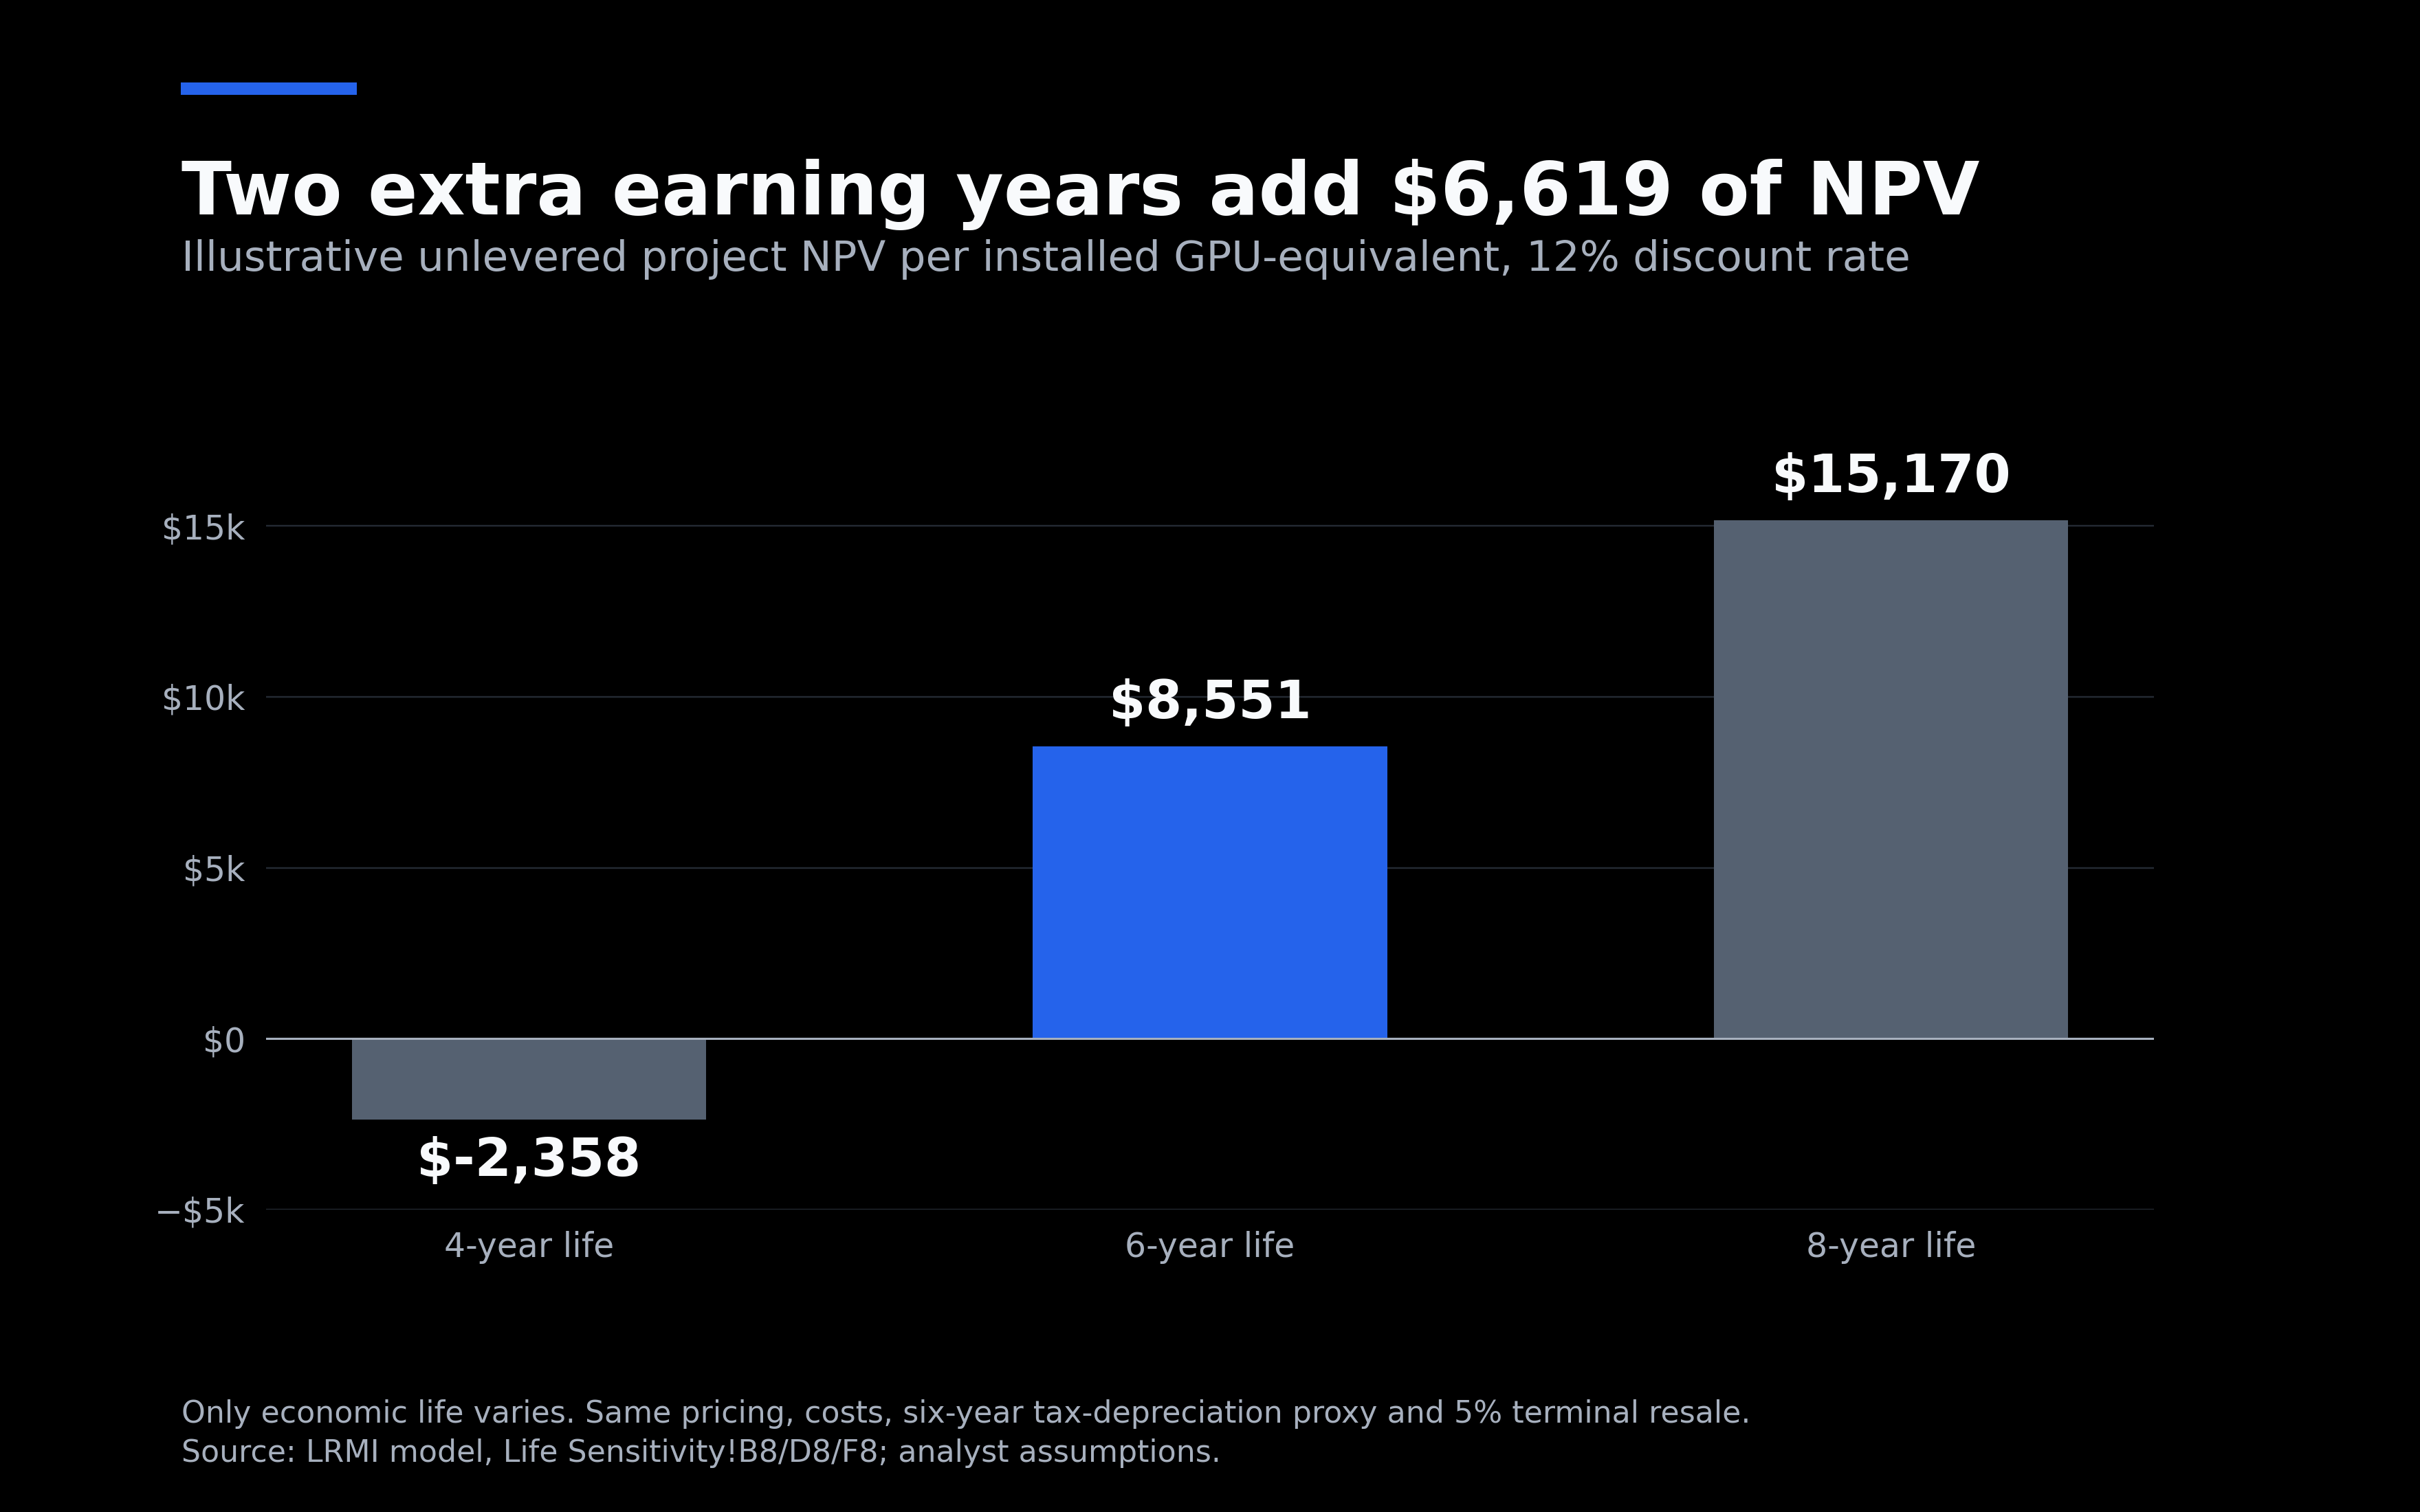
The four-year project produces approximately negative $2,358 of NPV. Six earning years produce positive $8,551. Eight produce positive $15,170.
Moving from six years to eight adds approximately $6,619 of present value per representative installed GPU-equivalent, even while rental rates decline. This is the key result: durable economics can improve lifetime returns without requiring perpetual appreciation.
The model separately tests more aggressive price erosion and stronger renewals. Its sensitivity grid makes the relationship visible.
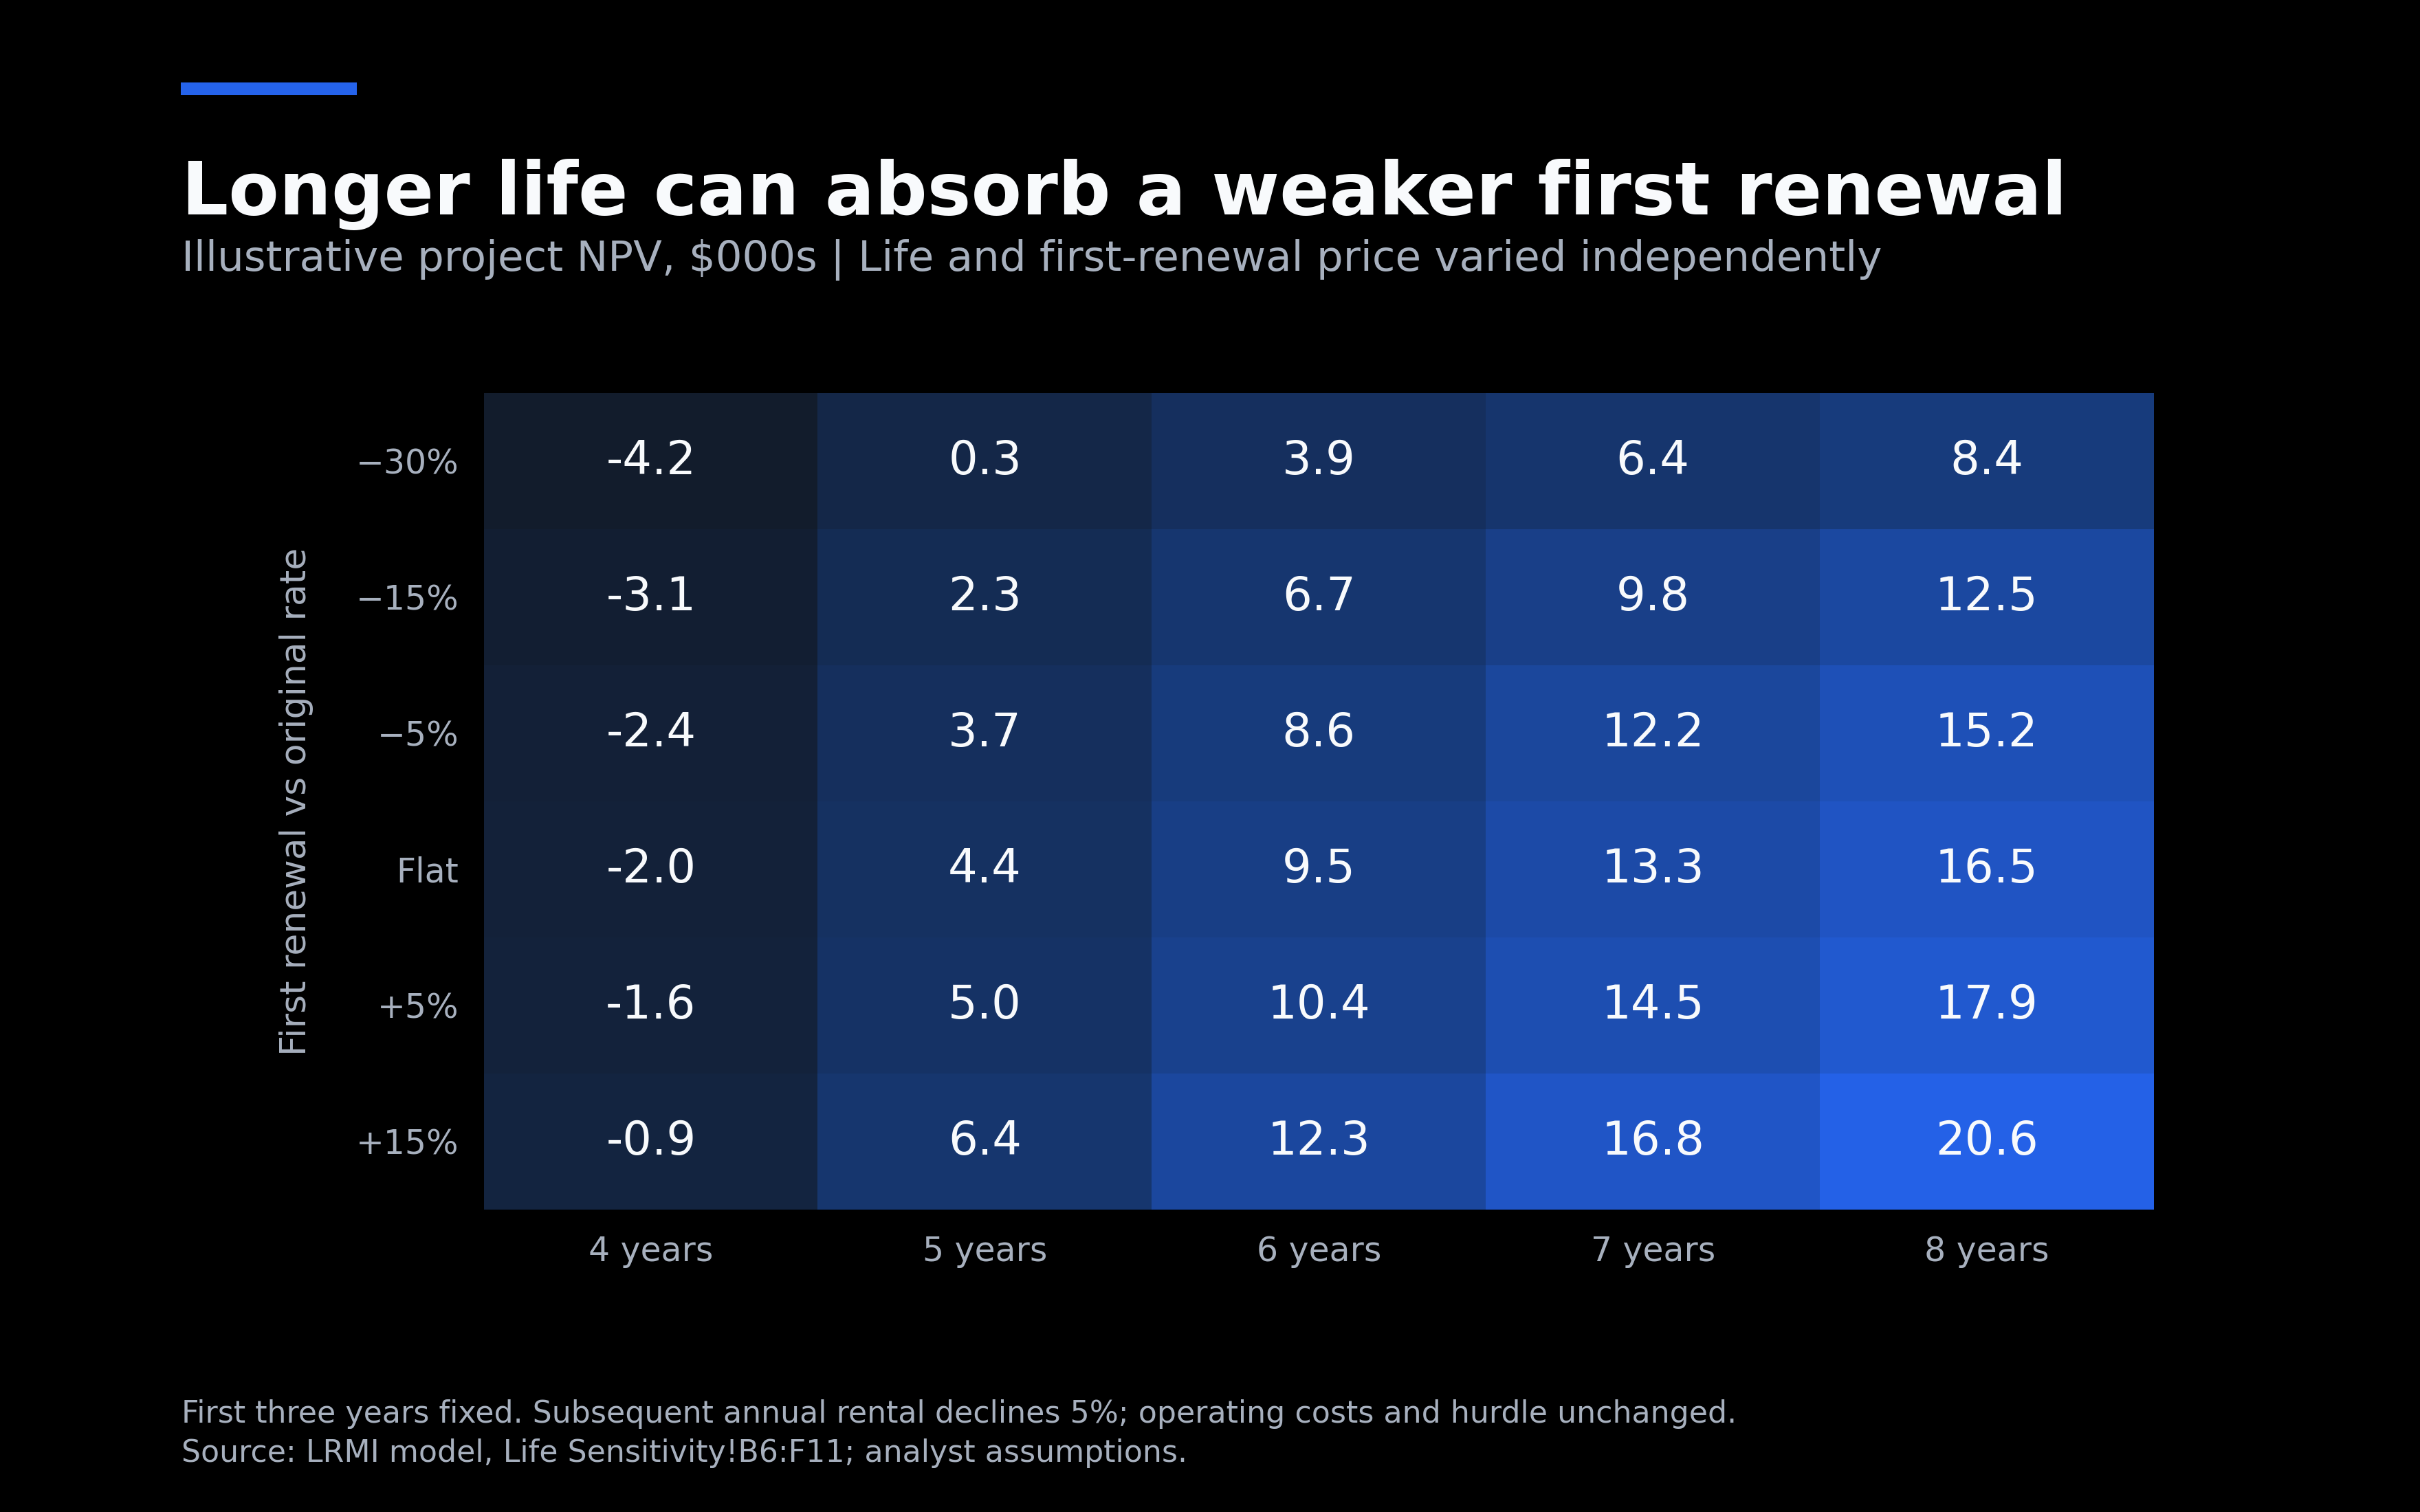
A longer life creates room for weaker pricing. It does not rescue every project. With enough price erosion, operating cost or upfront investment, extending the calendar can simply extend poor economics.
The equity upside runs through capital productivity
The most interesting bullish scenario is a business in which new capacity drives growth while older capacity keeps contributing cash.
If that happens, CoreWeave could earn more lifetime cash per dollar invested. Mature clusters could help fund expansion, support debt repayment and reduce the need for incremental equity financing. Evidence of repeatable capital recovery could also improve investors’ confidence in the durability of returns.
Each step is conditional. Growing EBITDA does not equal free cash flow, and a valuable installed fleet does not eliminate the cost of the next buildout. Higher collateral estimates may improve financing flexibility, but additional borrowings remain liabilities.
The valuation work therefore needs a sequence: deployment dates, realized billing, after-rent margins, maintenance and replacement expenditure, cash taxes, financing and dilution. Only then does an enterprise-value estimate become a common-equity value.
I would also resist multiplying the representative-project NPV by the projected year-end GPU count. Actual fleets contain different architectures, acquisition costs, contract terms and ages. A GPU added in December contributes little to that calendar year’s revenue. The corrected model distinguishes average deployed capacity from year-end capacity and keeps project economics separate from the corporate valuation bridge. [6]
The risk that can still defeat the thesis
Power is an opportunity cost. An older cluster can remain profitable in isolation and still be a less attractive use of scarce energized capacity than a newer system. Redeployment, infrastructure compatibility and the cost of conversion determine whether that comparison is actionable.
The other constraints are equally concrete: maintenance can rise, renewals can weaken, customers can fail to pay and expansion can require more financing than expected. A surviving chip is not automatically an attractive investment.
The question I want answered over the next several earnings reports is how much capital each mature cluster has recovered—and how much additional cash it can earn after renewal. Architecture-level renewal pricing, after-rent contribution margins, maintenance needs and financing amortization would make that answer much more useful than a single fleet-wide useful-life estimate.
For now, the A100 contract and residual-value estimates make a longer earning tail a serious underwriting case. The opportunity is to identify which operators can convert that durability into cash available to shareholders.
The next architecture expands the frontier. The next contract reveals the value of the installed fleet.
Sources and methodology
[1] CoreWeave, Q2 2026 earnings call, August 11, 2026. Management statements on prior-generation pricing and A100 bookings through 2029
[2] Nvidia, “Productive, Durable, Fungible: How NVIDIA AI Factories Maximize Return on Investment,” October 1, 2026
[3] Nvidia, September 2026 investor roadshow, slide 22. Underlying monthly residual-value estimates credited to Silicon Data
[4] a16z, “State of Markets II,” and user-supplied rental-price graphic credited to Silicon Data, dated September 7, 2026
[5] Amazon, Q2 2025 Form 10-Q, useful-life estimate change
[7] TBPN, interview with Mike Intrator, September 30, 2026, episode “White House AI Accord, Model Welfare, Ken Griffindor School of Market Wizardry”
Disclaimer: Research and scenario analysis, not a verified fair-value conclusion. Nvidia and CoreWeave have commercial interests in the durability argument; reported management claims and estimated market values should be tested against realized cluster cash flows.