
The Chart That Shows Why Oil Isn't Done Yet
This is what panic looks like in the oil market.

Look at that chart.
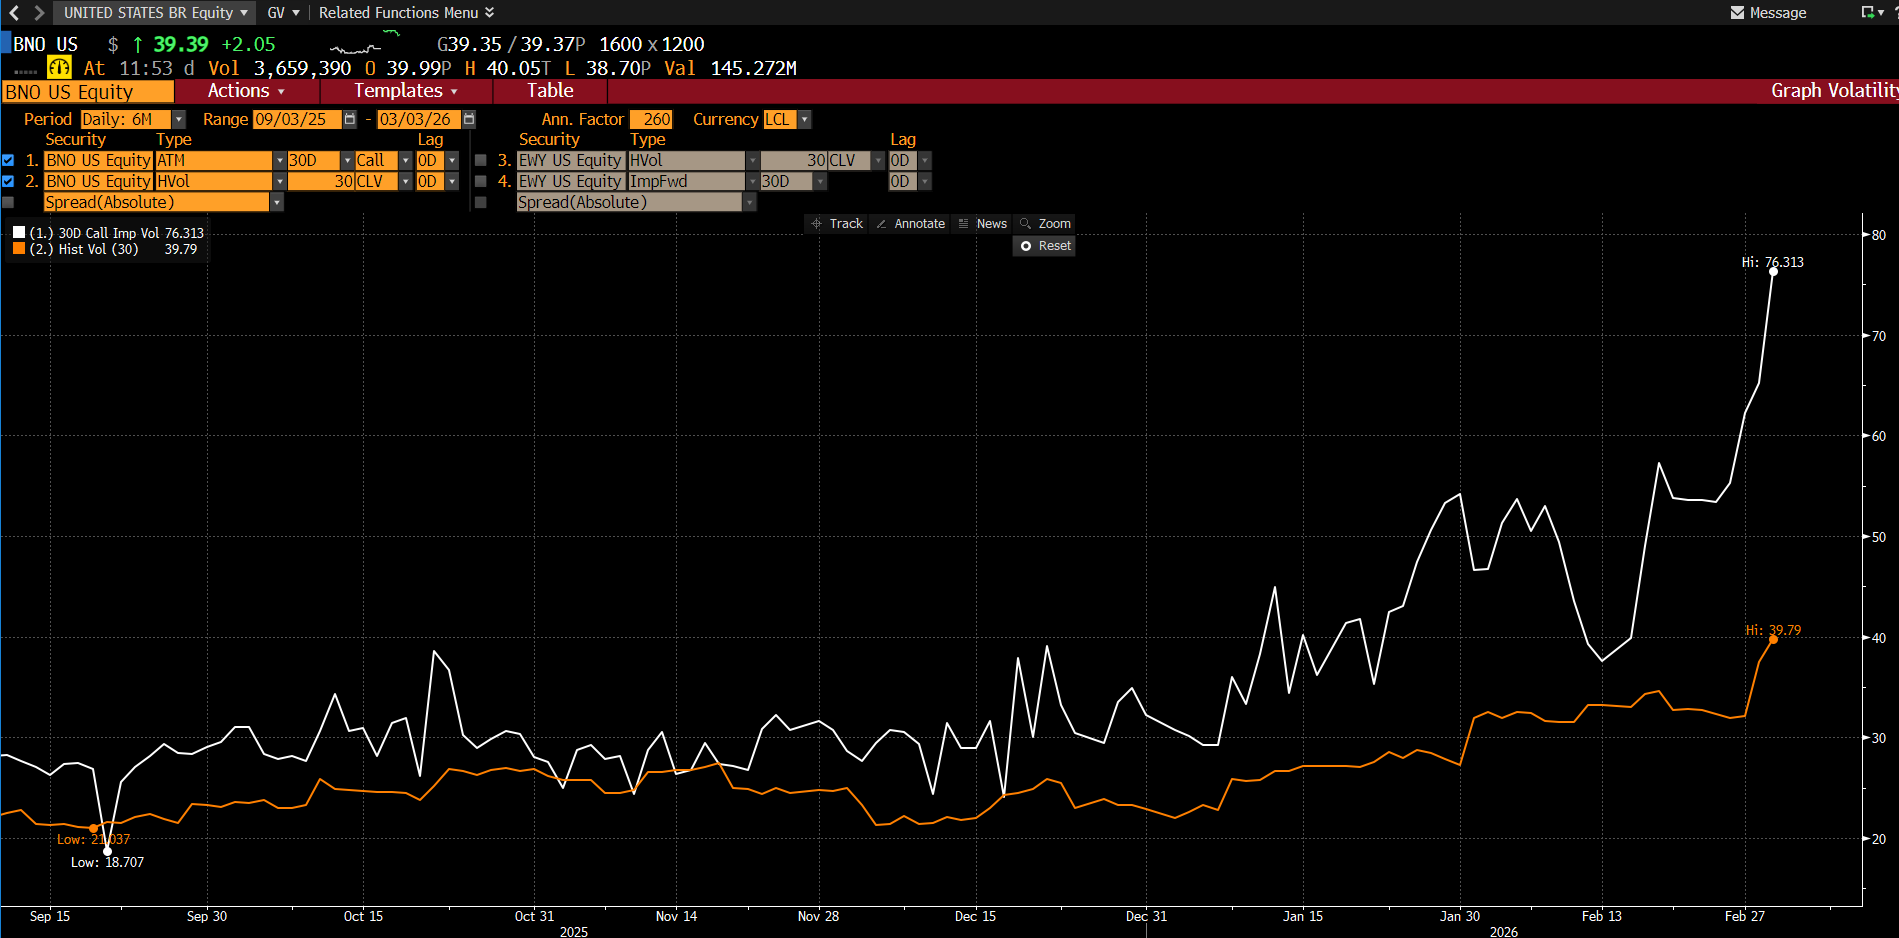
White line: 30-day implied volatility at 76.3 — options traders pricing in apocalypse scenarios
Orange line: Historical volatility at 39.8 — what’s actually happening
The gap: Pure geopolitical fear premium
When that white line spikes to 76, it means the options market is pricing in extreme tail events. Translation: traders are hedging for $100+ oil.
And they’re doing it for a reason.
What Changed in 72 Hours
I sold my BNO 0.00%↑ BNO 35 calls Monday morning at +60%. Thought I was being disciplined — locking in gains before the typical geopolitical spike fades.
Those calls are now worth +400%!
Here’s what I got wrong: I sold into the headlines, not the physical reality.
The market has been comparing this to June 2025’s Operation Midnight Hammer. Quick surgical strikes, brief oil spike, fast ceasefire. Pattern recognition says fade the move.
But this isn’t June 2025. Not even close.
The Physical Market Is Breaking
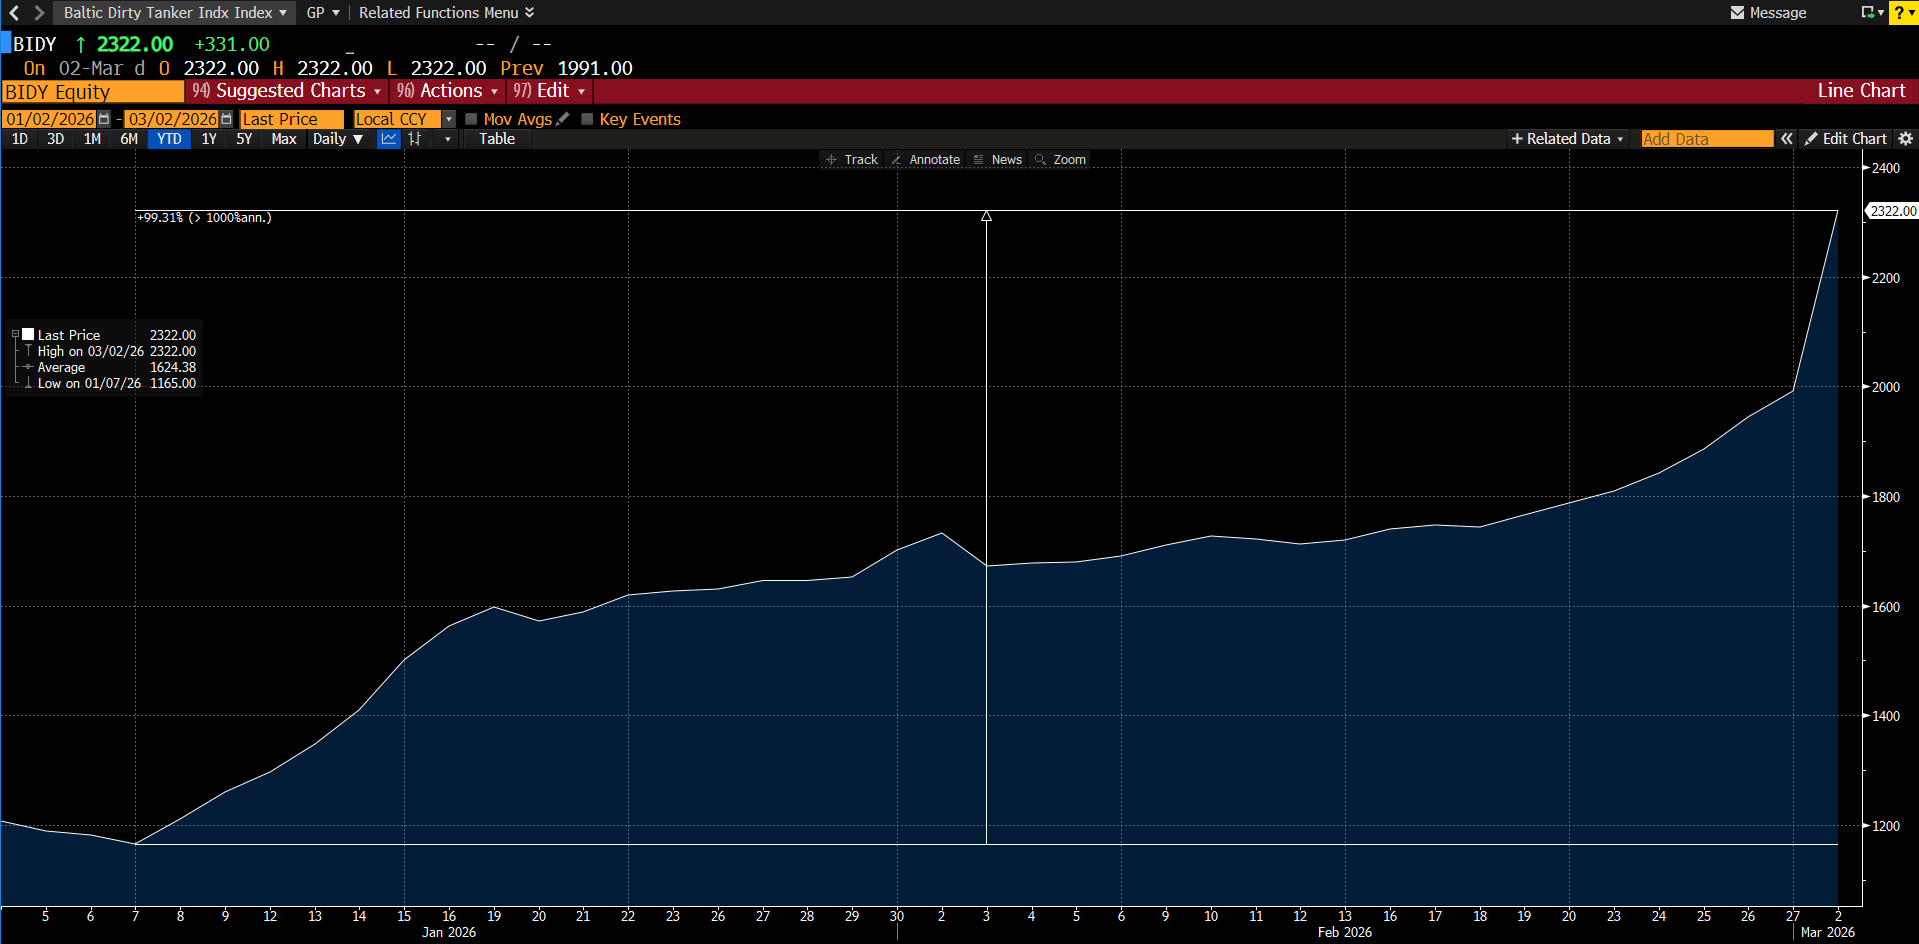
The Baltic Dirty Tanker Index (BIDY) — the rate shipowners charge to move crude — just hit 2322, up +331 points in a single day. That’s a +99% move from January and an all-time high in the data series (YTD).
This isn’t a fear trade. This is what happens when the Strait of Hormuz physically closes.
Here’s the timeline:
Saturday, Feb 28: US/Israel launch Operation Epic Fury. Supreme Leader Khamenei killed.
Sunday, March 1: Iran retaliates. IRGC commander declares Hormuz “closed” and threatens to set any passing vessel “ablaze.”
Monday, March 2: Insurance coverage withdrawn. Major shipping lines halt all Gulf transits. Oil spikes to $82/barrel intraday before fading to $79.
Tuesday, March 3: Qatar halts ALL LNG production after Iranian strikes on operating facilities. Gulf refineries sustain damage. Tanker traffic still at zero.
Today: BNO at $39.39. Brent holding $84. BIDY still climbing.
The Market Is Underpricing Duration
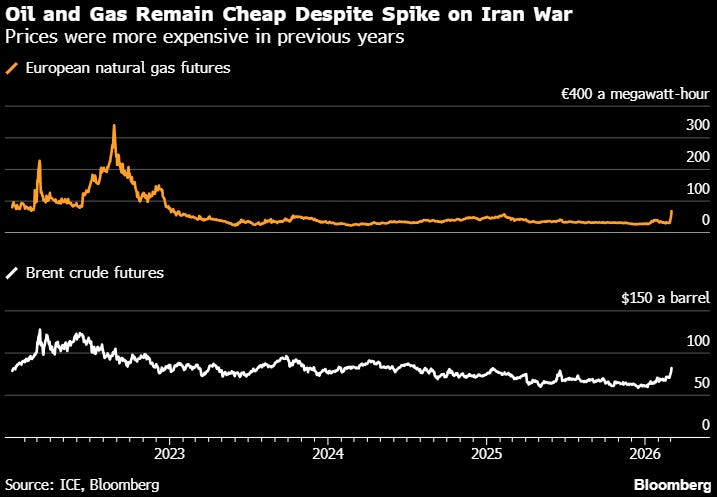
Bloomberg’s headline today: “Prices were more expensive in previous years.”
That’s the consensus view. And it’s wrong.
The market is anchoring to:
June 2025 precedent (quick fade after ceasefire)
OPEC+ spare capacity (Saudi/UAE can flood the market)
Demand destruction (high prices will kill consumption)
But look at what’s actually different this time:
June 2025:
Surgical strikes on nuclear facilities
No leadership decapitation
Hormuz stayed open
Ceasefire in 12 days
March 2026:
Regime collapse (Khamenei dead, succession unclear)
Hormuz physically closed for 5+ days
Gulf infrastructure damaged (not just targeted)
Iran has no incentive to negotiate — they’re fighting for survival
Trump said “weeks” not “days”
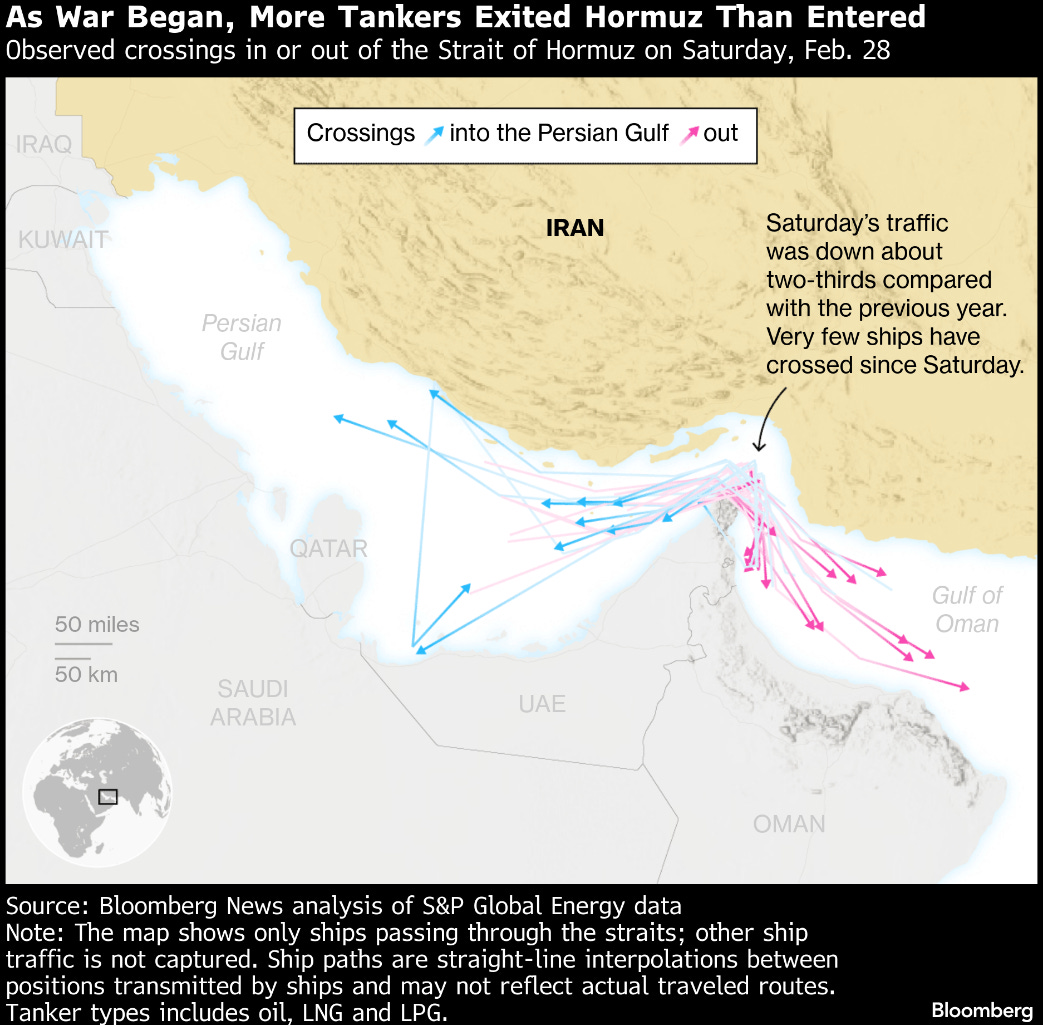
Hormuz normally handles 15-20 million barrels per day — roughly 20% of global oil supply. That flow is now at ~5 million barrels per day. The other 15 million are stranded.
Analysts keep saying “OPEC+ spare capacity can cover this.” But here’s the problem: most Gulf spare capacity can’t reach global markets if Hormuz stays closed.
Saudi Arabia’s East-West Pipeline can move ~7 million bpd to Red Sea export terminals. UAE’s Fujairah pipeline adds capacity. But that infrastructure is already being targeted by Iranian missiles.
What The Smart Money Is Doing
Here’s what I’m watching now that tells me this isn’t over:
1. BIDY holding at 5-Year Highs — If this was a quick resolution, tanker rates would be fading. They’re not. They’re climbing.
2. Qatar LNG halt — This is the second-largest LNG exporter globally going offline. European nat gas futures spiked +50% overnight. That’s not priced into the crude curve yet.
3. Trump announced Navy escorts — When the President has to promise military protection for commercial tankers, that confirms the closure is real and sustained, not a bluff.
4. Gasoline prices +11 cents overnight — The biggest single-day spike since March 2022 (Ukraine invasion). Retail prices hit $3.11/gallon and analysts are forecasting $3.25-3.50 in coming weeks. That’s an inflation shock coming right as the Fed was ready to cut rates.
5. Treasury yields climbing — 10-year yields saw their biggest one-day jump since October. The bond market is pricing in persistent inflation from energy, which kills the rate cut narrative.
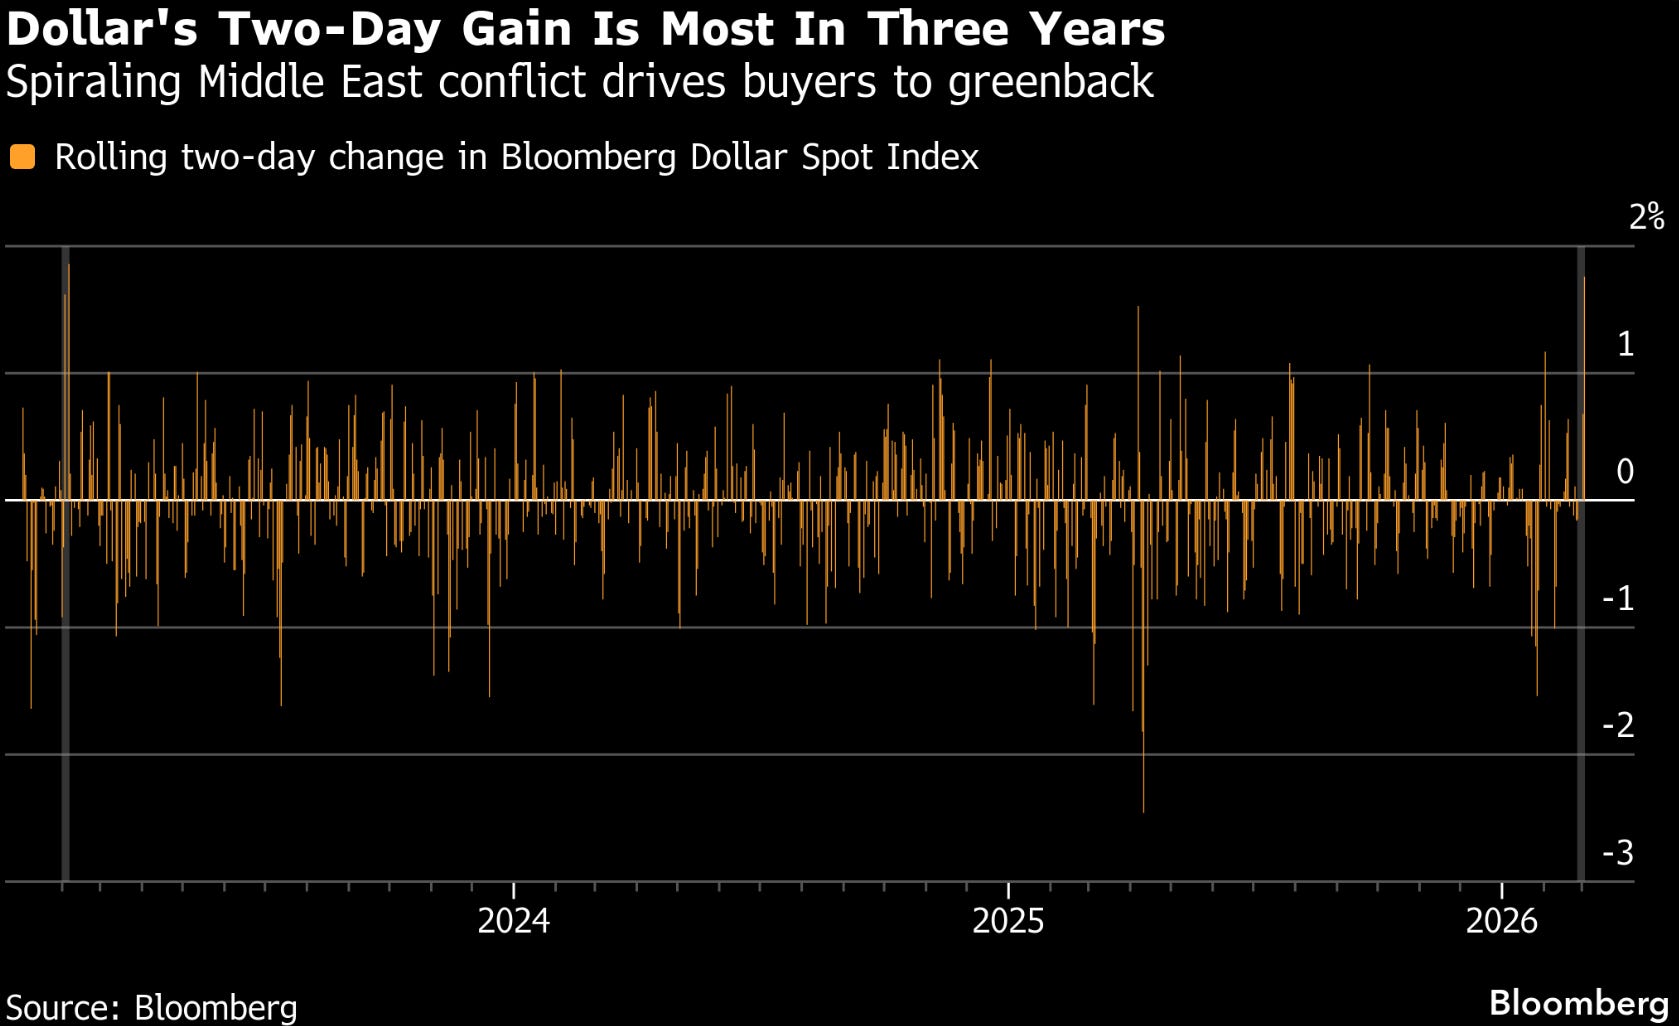
The DXY UUP 0.00%↑ spiked ~2% in two days — the biggest flight-to-safety move in three years. When the dollar, gold, and oil all rally together, that’s risk-off with an inflation premium. That combination destroys multiple expansion.
The Three Scenarios From Here
I’m not chasing BNO at $39. But I’m watching the setup for what comes next.
Scenario 1: Hormuz Stays Shut (35% probability)
Oil → $100+
If this extends beyond 7-10 days, strategic reserves start getting drawn down and OPEC+ proves unable to fully offset lost Gulf exports. China’s strategic stockpiles deplete. Brent breaks $100.
Trades:
Long energy equities (CVX, XOM, XLE)
Long VIX / volatility
Short airlines, consumer discretionary
Long defensive sectors (staples, utilities)
Scenario 2: Partial Reopening Within 7-10 Days (40% probability)
Oil → $80-90 range
US Navy escorts begin operating. Some tankers resume transit with war-risk insurance. Sporadic Iranian attacks continue but throughput gradually normalizes. Trump-Xi summit (March 31) produces framework for Iran negotiations.
Trades:
Neutral energy exposure
Rotate into quality growth (MSFT, GOOGL) on any dip
Watch for demand destruction signals (retail sales, jobless claims)
Scenario 3: Quick Resolution (25% probability)
Oil → back to $70
Iran’s new leadership sues for peace within days. US achieves rapid denuclearization agreement. Hormuz reopens fully. OPEC+ floods market April 1. Oil gives back the entire move.
Trades:
Fade energy on any spike above $90
Long tech, long duration
Short VIX on any spike above 30
What I’m Monitoring Now
I’m not predicting. I’m watching the data and letting it tell me which scenario we’re in.
Weekly checklist:
BIDY levels — If tanker rates roll over below 2000, Scenario 3 is playing out. If they hold above 2200 or keep climbing, Scenario 1 is live.
Hormuz traffic flow — Kpler and Windward publish daily vessel counts. Watching for resumption of normal flows (15M+ bpd).
US gasoline prices — If retail hits $3.50, demand destruction kicks in and Fed stays on hold. That’s the macro regime shift.
Trump announcements — Navy escort timeline, Iran negotiation progress, any shift in “weeks” language.
OPEC+ emergency meeting — If they convene before the scheduled April 5 meeting, that signals panic about lost market share.
Iran domestic stability — Post-Khamenei succession fights, labor strikes at Kharg Island terminal, potential collapse of export infrastructure.
The Lesson
Good traders get the direction right. Great traders get the exit right.
I called Operation Epic Fury 9 days early using OSINT + Bloomberg terminal data. Positioned in BNO C35 calls. Locked +60% Monday thinking I was being disciplined.
And I left +340% on the table by selling into noise instead of physical confirmation.
The move I should have made: scale out in thirds.
1/3 at Monday open (+60%) → lock in base case
1/3 when BIDY confirmed the closure was sustained (Tuesday)
1/3 with a trailing stop at new highs (today)
Blended return would have been ~170% instead of 60%.
The difference between good and great isn’t the analysis. It’s the execution discipline.
When you’re trading geopolitical events, the headline is not the trade. The physical consequence is the trade.
Hormuz isn’t open yet. The tanker market is still pricing in apocalypse. And the oil curve still hasn’t caught up to what the options market is screaming.
This isn’t done.
Bottom line: I’m not chasing BNO here. But I’m watching BIDY, Hormuz traffic, and gasoline prices for the next setup. If we’re in Scenario 1 (extended closure), the energy/defensives rotation is just getting started. If we’re in Scenario 3 (quick resolution), fading energy above $90 is the play.
The market will tell us which one. We just have to listen to the physical data, not the headlines.
Disclaimer: NFA. This is for educational purposes only.