
Oil Stocks Diverge From Crude — What the Charts Are Really Telling Us
Equity markets are pricing in a world that crude futures aren't yet willing to confirm.

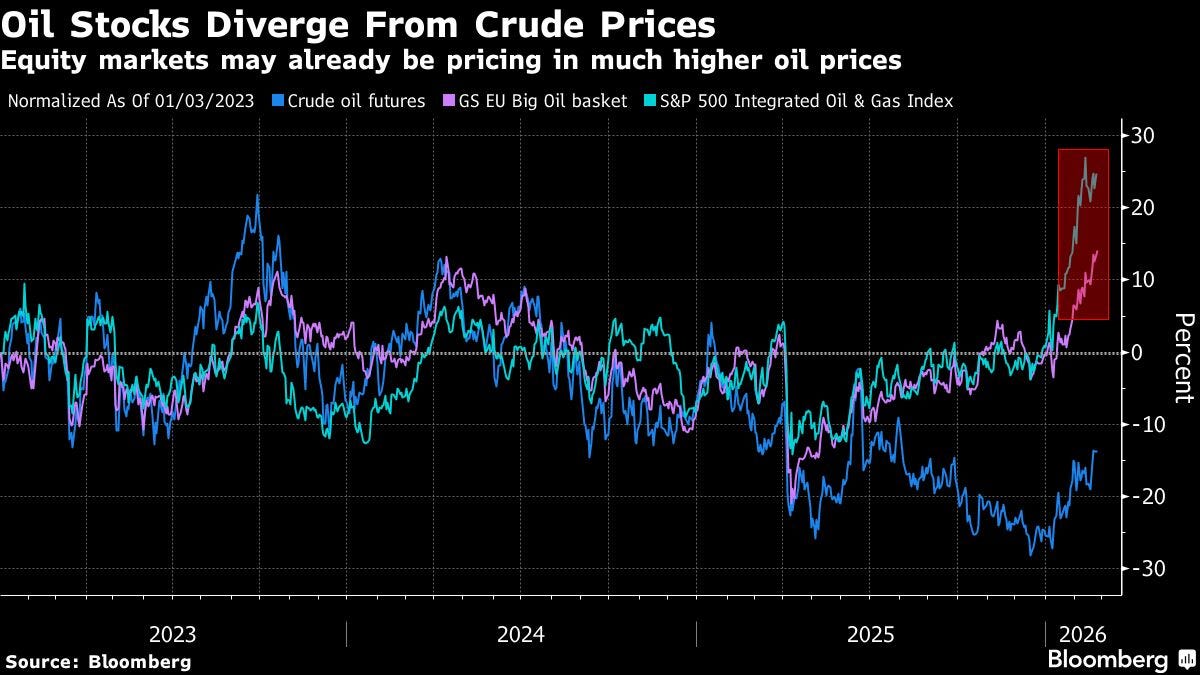
Global oil producers have ripped more than 20% YTD, blowing past crude futures which remain anchored by persistent oversupply concerns. The divergence — visible in the Bloomberg chart above — cracked open around mid-2025 and has only widened since. Integrated oil names are being bought aggressively even as the commodity itself refuses to confirm the move.
The market is making a bet. The question is whether it’s right.
What the vol surface is telling us
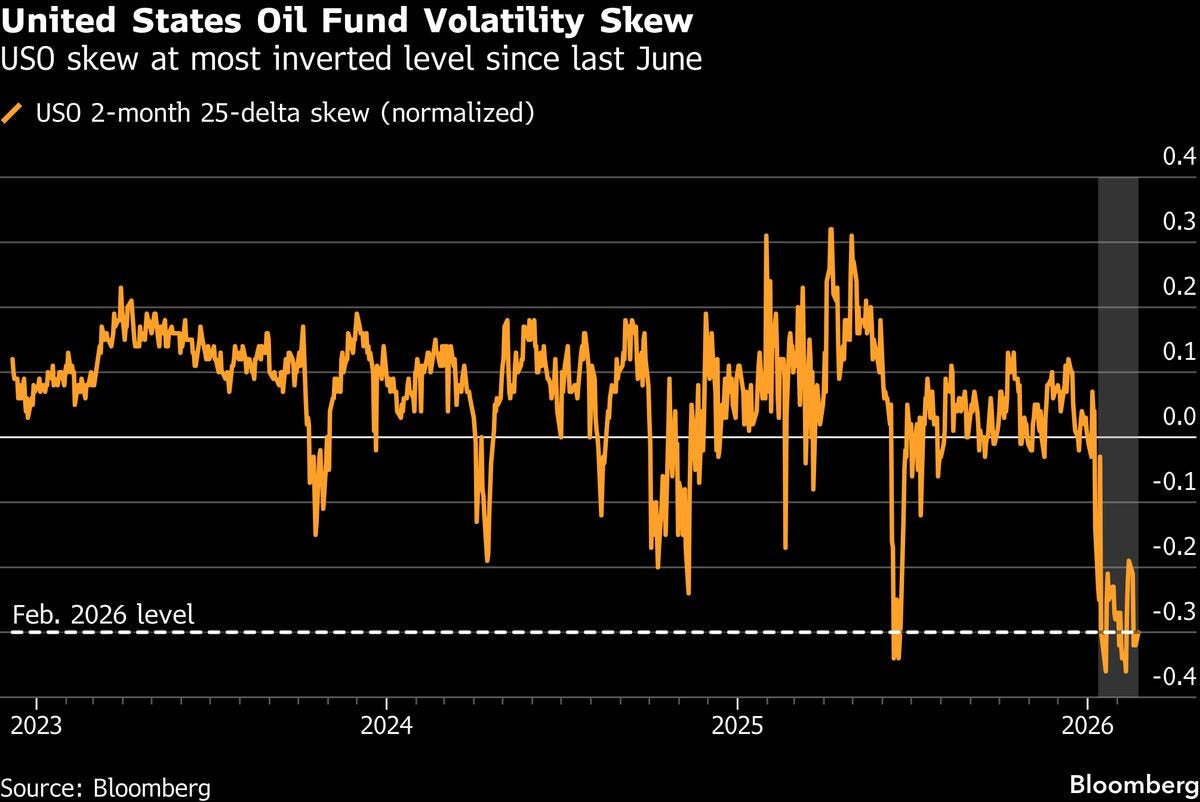
The USO 2-month 25-delta skew just hit its most inverted level since last June — meaning options markets are pricing meaningful upside tail risk in crude. But here’s the nuance Barclays’ derivatives desk (Pascale et al.) is flagging: the skew, while extreme, is still consistent with a contained event risk. Not a regime-change scenario. Not a Persian Gulf closure.
For context, absolute implied vol in oil is now above levels seen during the Ukraine invasion buildup — but still shy of peak invasion-phase readings, per UBS’s Shane Carroll. That gap matters. It’s the market saying “serious, but not catastrophic.”
The base case the smart money is playing
The more probable path being priced isn’t escalation — it’s coercion. The US pressuring Iran back to the nuclear negotiating table, not regime change. That’s a very different risk profile, and it suggests oil equity longs may be running ahead of a fundamental catalyst that never fully materializes.
When equities price in $90+ oil and crude sits at $70, someone is wrong.
The divergence between oil stocks and crude prices is one of the cleanest asymmetric setups in the energy complex right now. Watch the skew normalization — that’s your tell!
Disclaimer: This is for educational purposes only.