
How I Built a Monte Carlo Model That Found a 25% Edge on Super Bowl LX
What happens when you apply hedge fund-grade quantitative analysis to sports betting? You find mis-pricings the market missed.

Three weeks ago, my UFC betting model went 5/5 with 373% ROI in a single night. The secret? Live-scraped fighter data, 10,000 Monte Carlo simulations per fight, and Kelly Criterion position sizing. Pure systematic alpha extraction.
Naturally, I pointed it at the Super Bowl.

The Model vs The Market
Vegas says:
Seahawks -225 (69% implied)
Patriots +184 (35% implied)
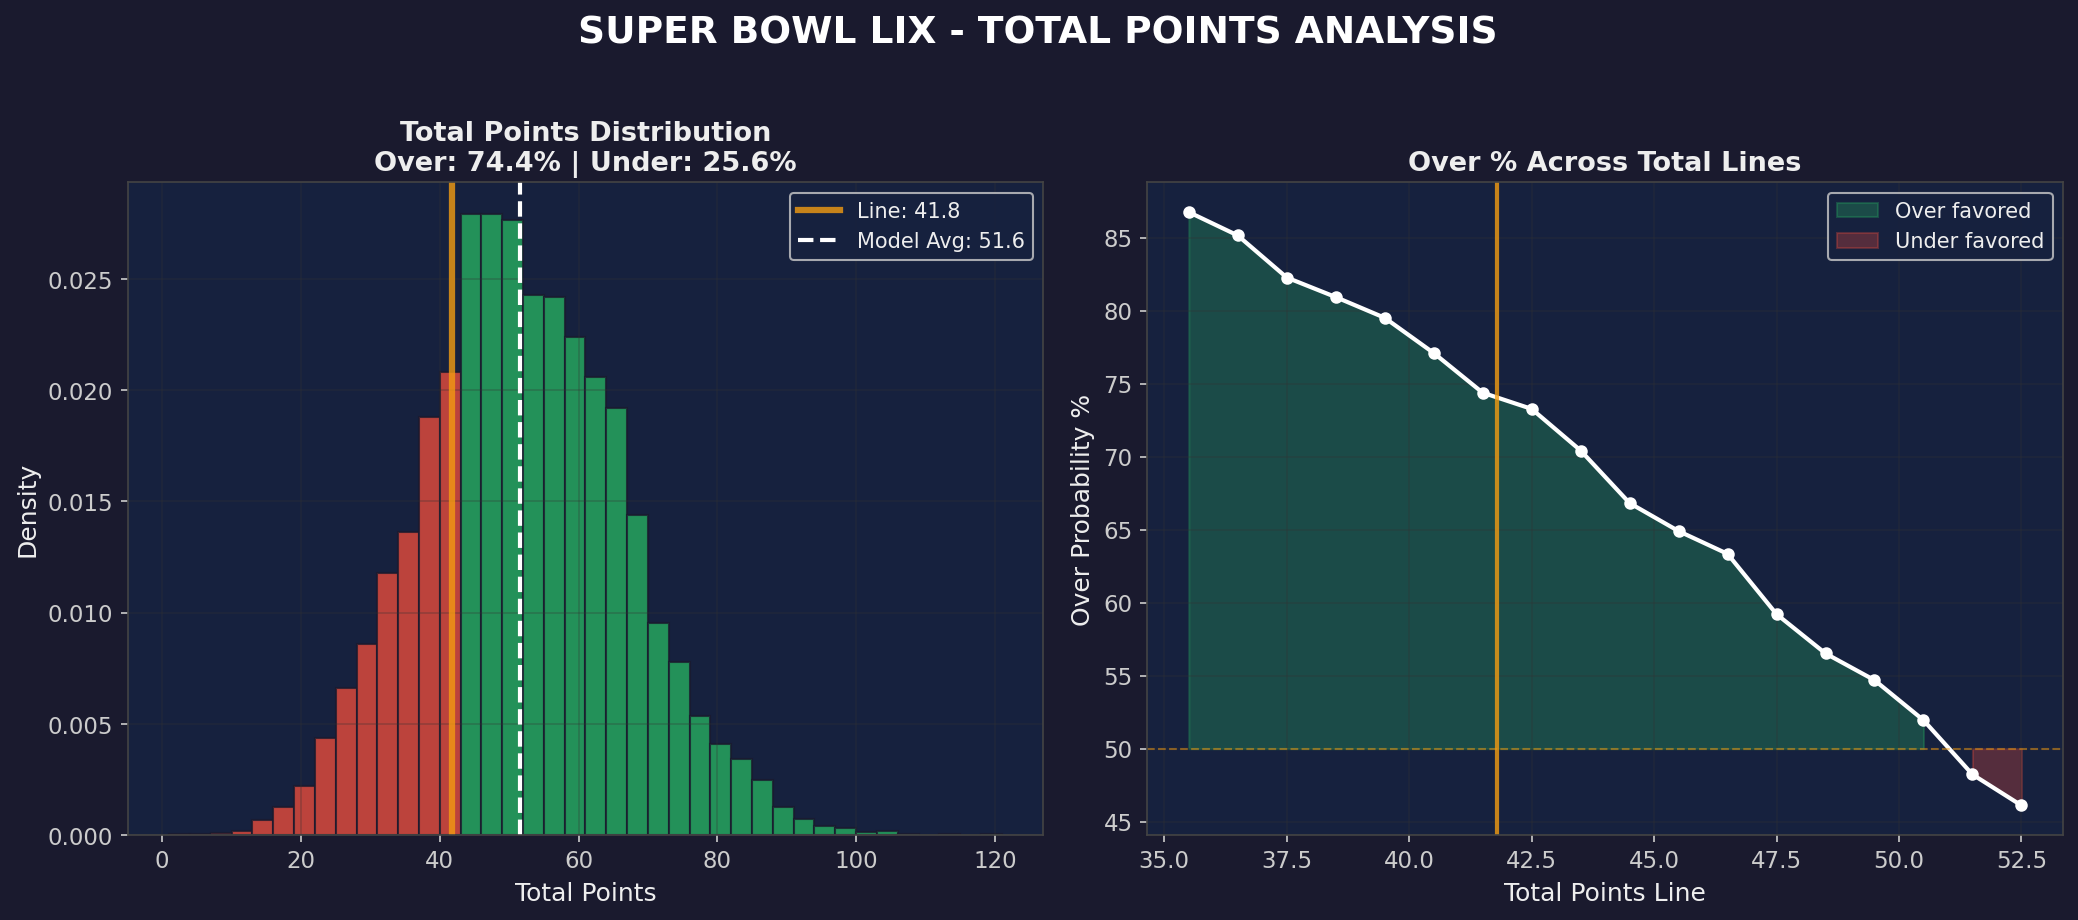
Total: 41.8 points
My model (10,000 simulations) says:
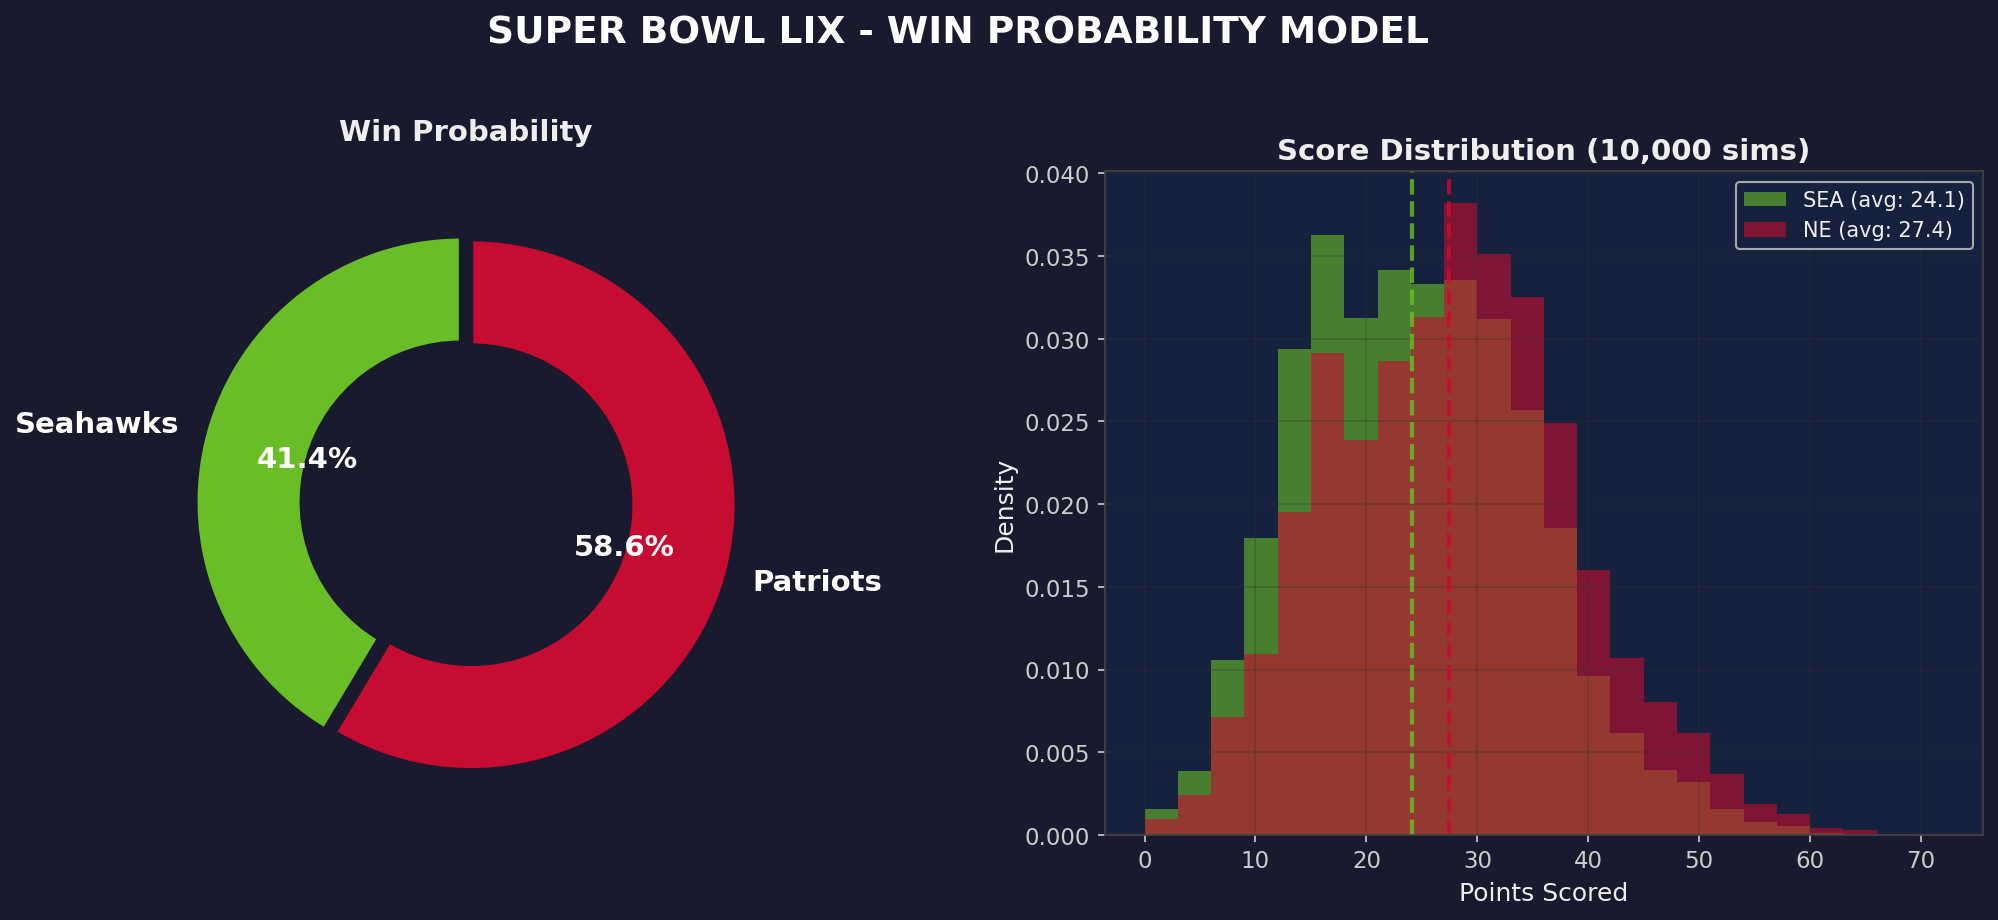
Patriots: 58.6% win probability
Projected score: Patriots 27.4, Seahawks 24.1
Total: 51.6 points
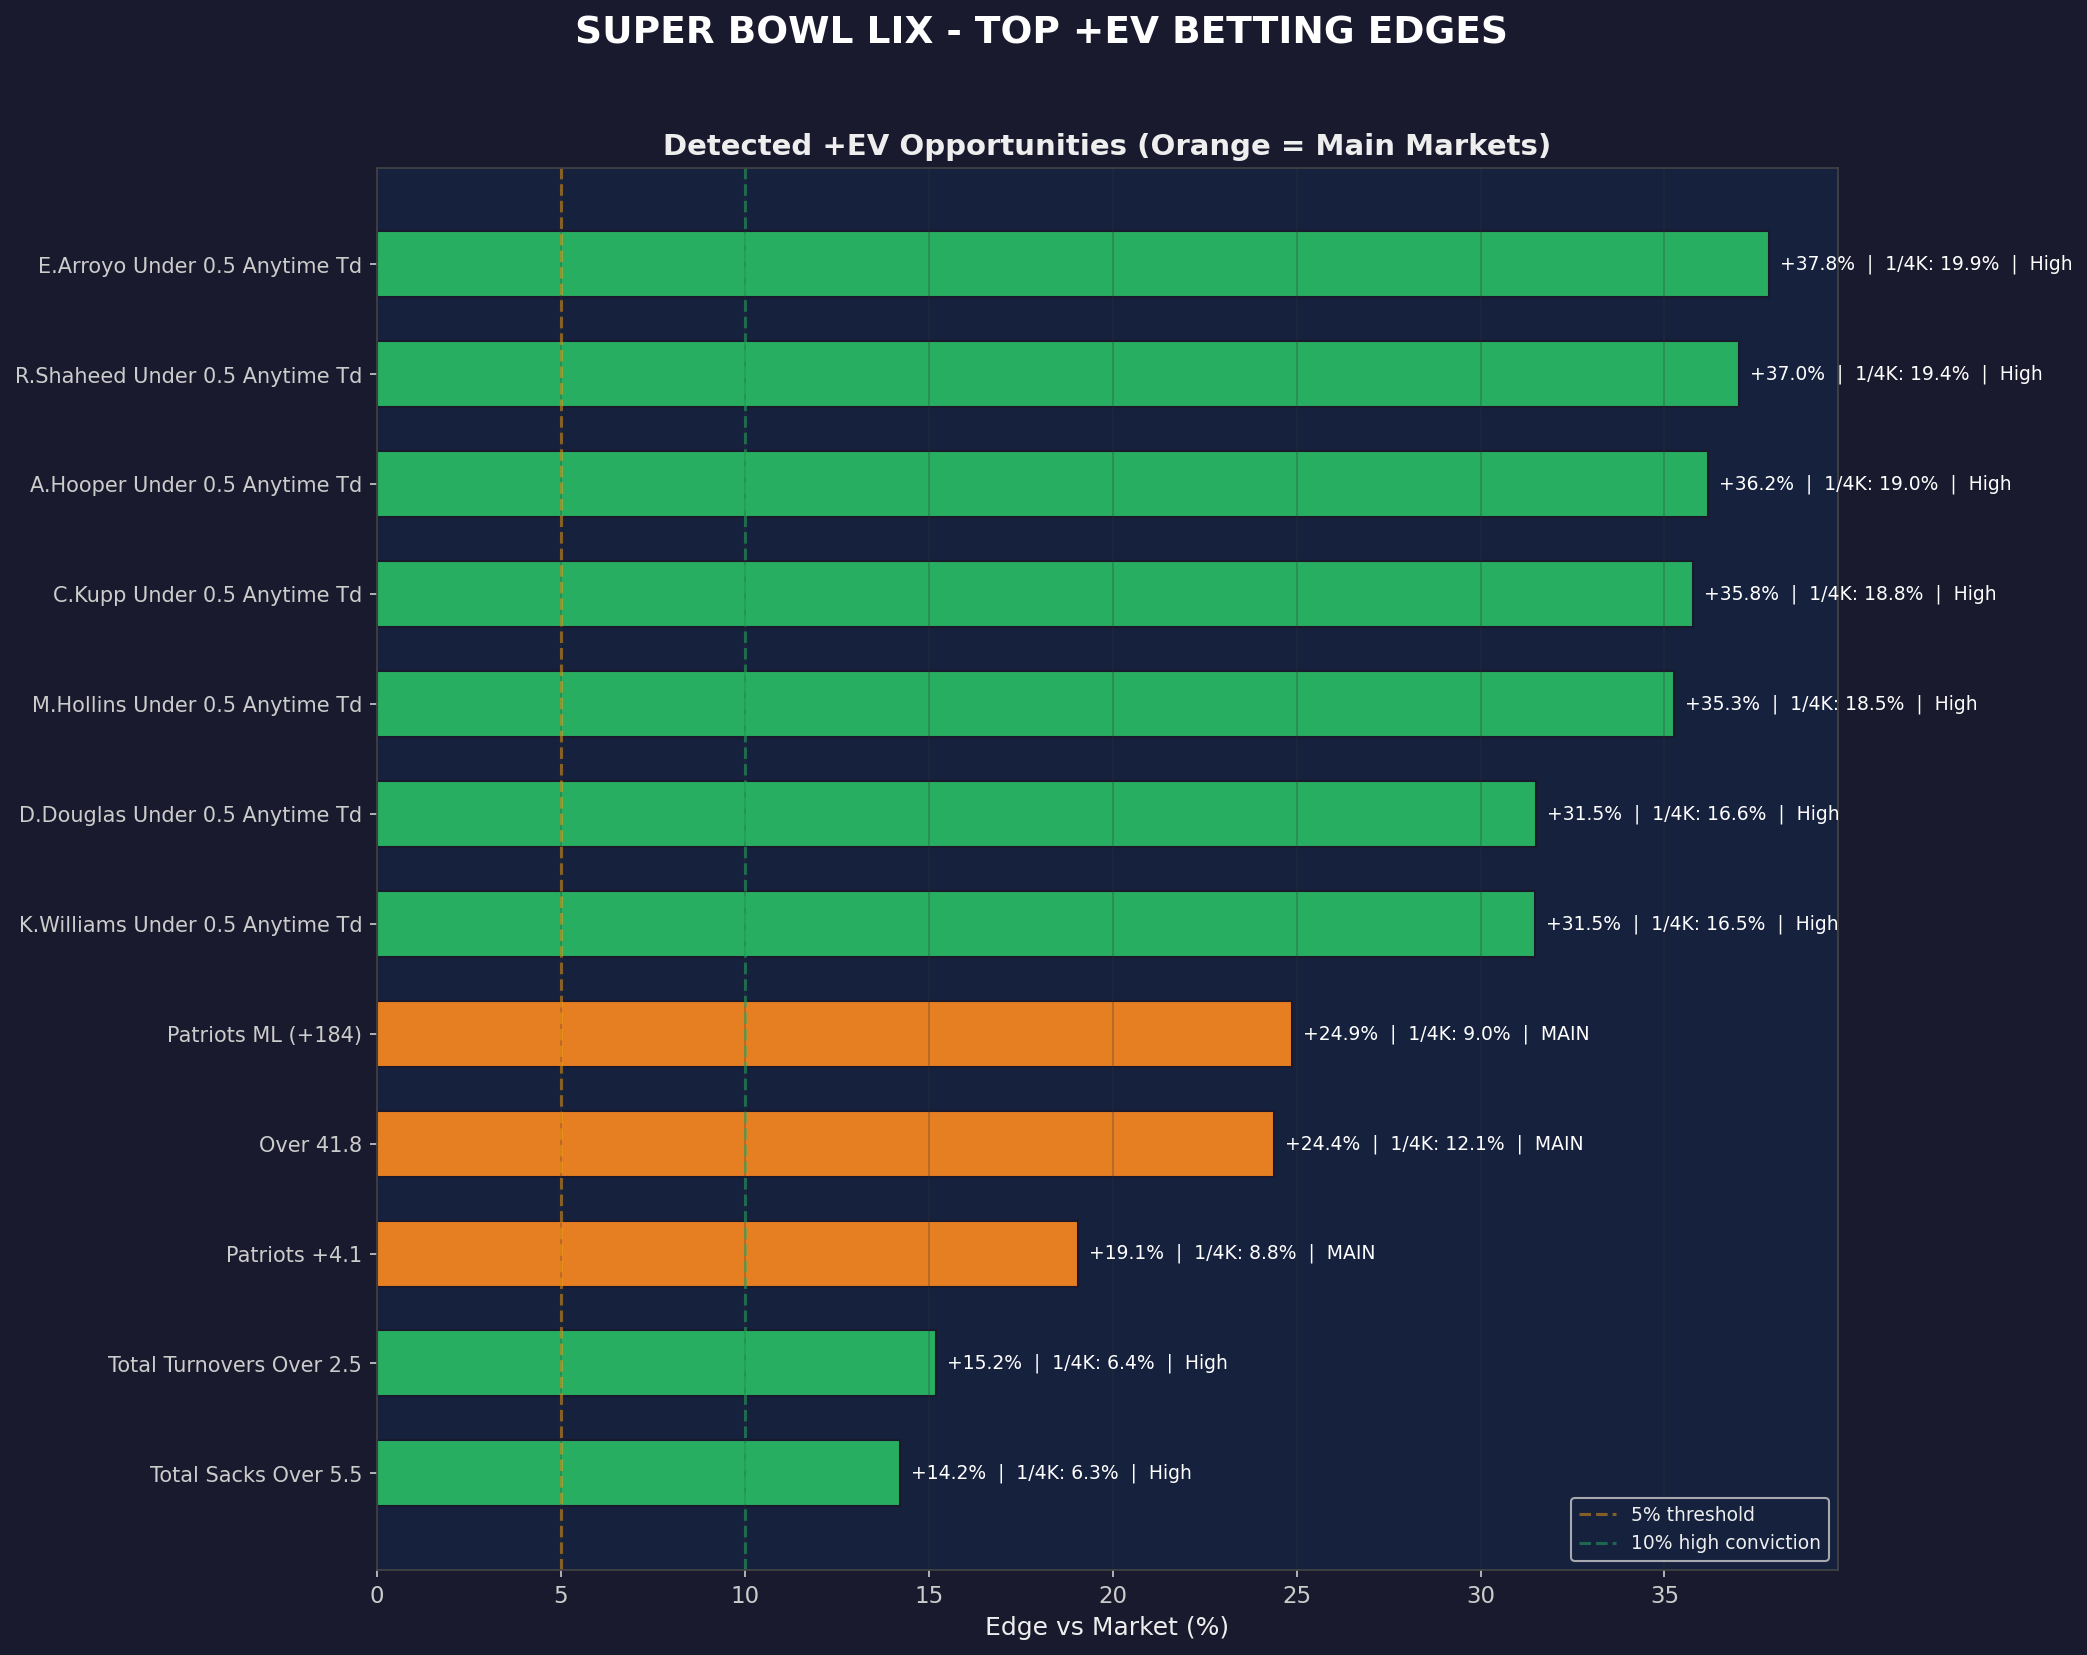
Edge detected: Patriots ML +24.9%
Second-largest edge I’ve ever found (UFC 324’s Silva at +48.2% was #1).
The Validation: Five Reality Checks
A 25% Super Bowl edge shouldn’t exist. I stress-tested everything.
Test 1: The Turnover Problem
Full-season stats showed Seahawks turned it over 1.94x/game. But the timeline reveals everything:
First half season: Seahawks 1.88 TO/game, Patriots 2.00 TO/game
Second half: Seahawks 0.89, Patriots 0.12
Playoffs: Seahawks 0.00 (perfect), Patriots 2.67 (disaster)
Sam Darnold fixed his issue. Patriots got sloppy. This should kill my thesis.
The model still showed +10-25% Patriots edge at every playoff weighting.
Test 2: Playoff Weighting Sensitivity
I ran six scenarios from “only regular season matters” to “only playoffs matter”:
Regular season only: Patriots +24.9% edge
2x playoff weight: Patriots +19.8% edge
4x playoff weight: Patriots +10.6% edge
6x playoff weight: Patriots +5.8% edge
Even at extreme recency bias, the edge holds. Why? The model sees a 3-point game. The market is pricing a Seahawks blowout.
What Vegas Missed
1. Patriots offensive firepower is underpriced
They scored 18 PPG in playoffs because they played #1 Denver and elite defenses in grinding defensive battles. Regular season: 28.8 PPG, 132.0 passer rating. That offense shows up Sunday.
2. Seahawks’ perfection will regress
0 turnovers in 2 playoff games from a QB with 30+ in the first half of the season? 94.1% red zone efficiency? 36 PPG against average defenses? None of this is sustainable under Super Bowl pressure.
3. Mean reversion cuts both ways
Darnold’s streak ends. Patriots’ playoff sloppiness improves. Both converge to their true talent levels.
The Player Props Edge
Model found systematic TE mismatches:
Hunter Henry O43.5 rec yards: +10% edge (projects 51.0)
AJ Barner O29.5 rec yards: +9.7% edge (projects 34.2)
Sam Darnold O226.5 pass yards: +8.5% edge (projects 245.4)
Both defenses lock down WRs but are vulnerable to TEs in the middle. Classic structural exploit.
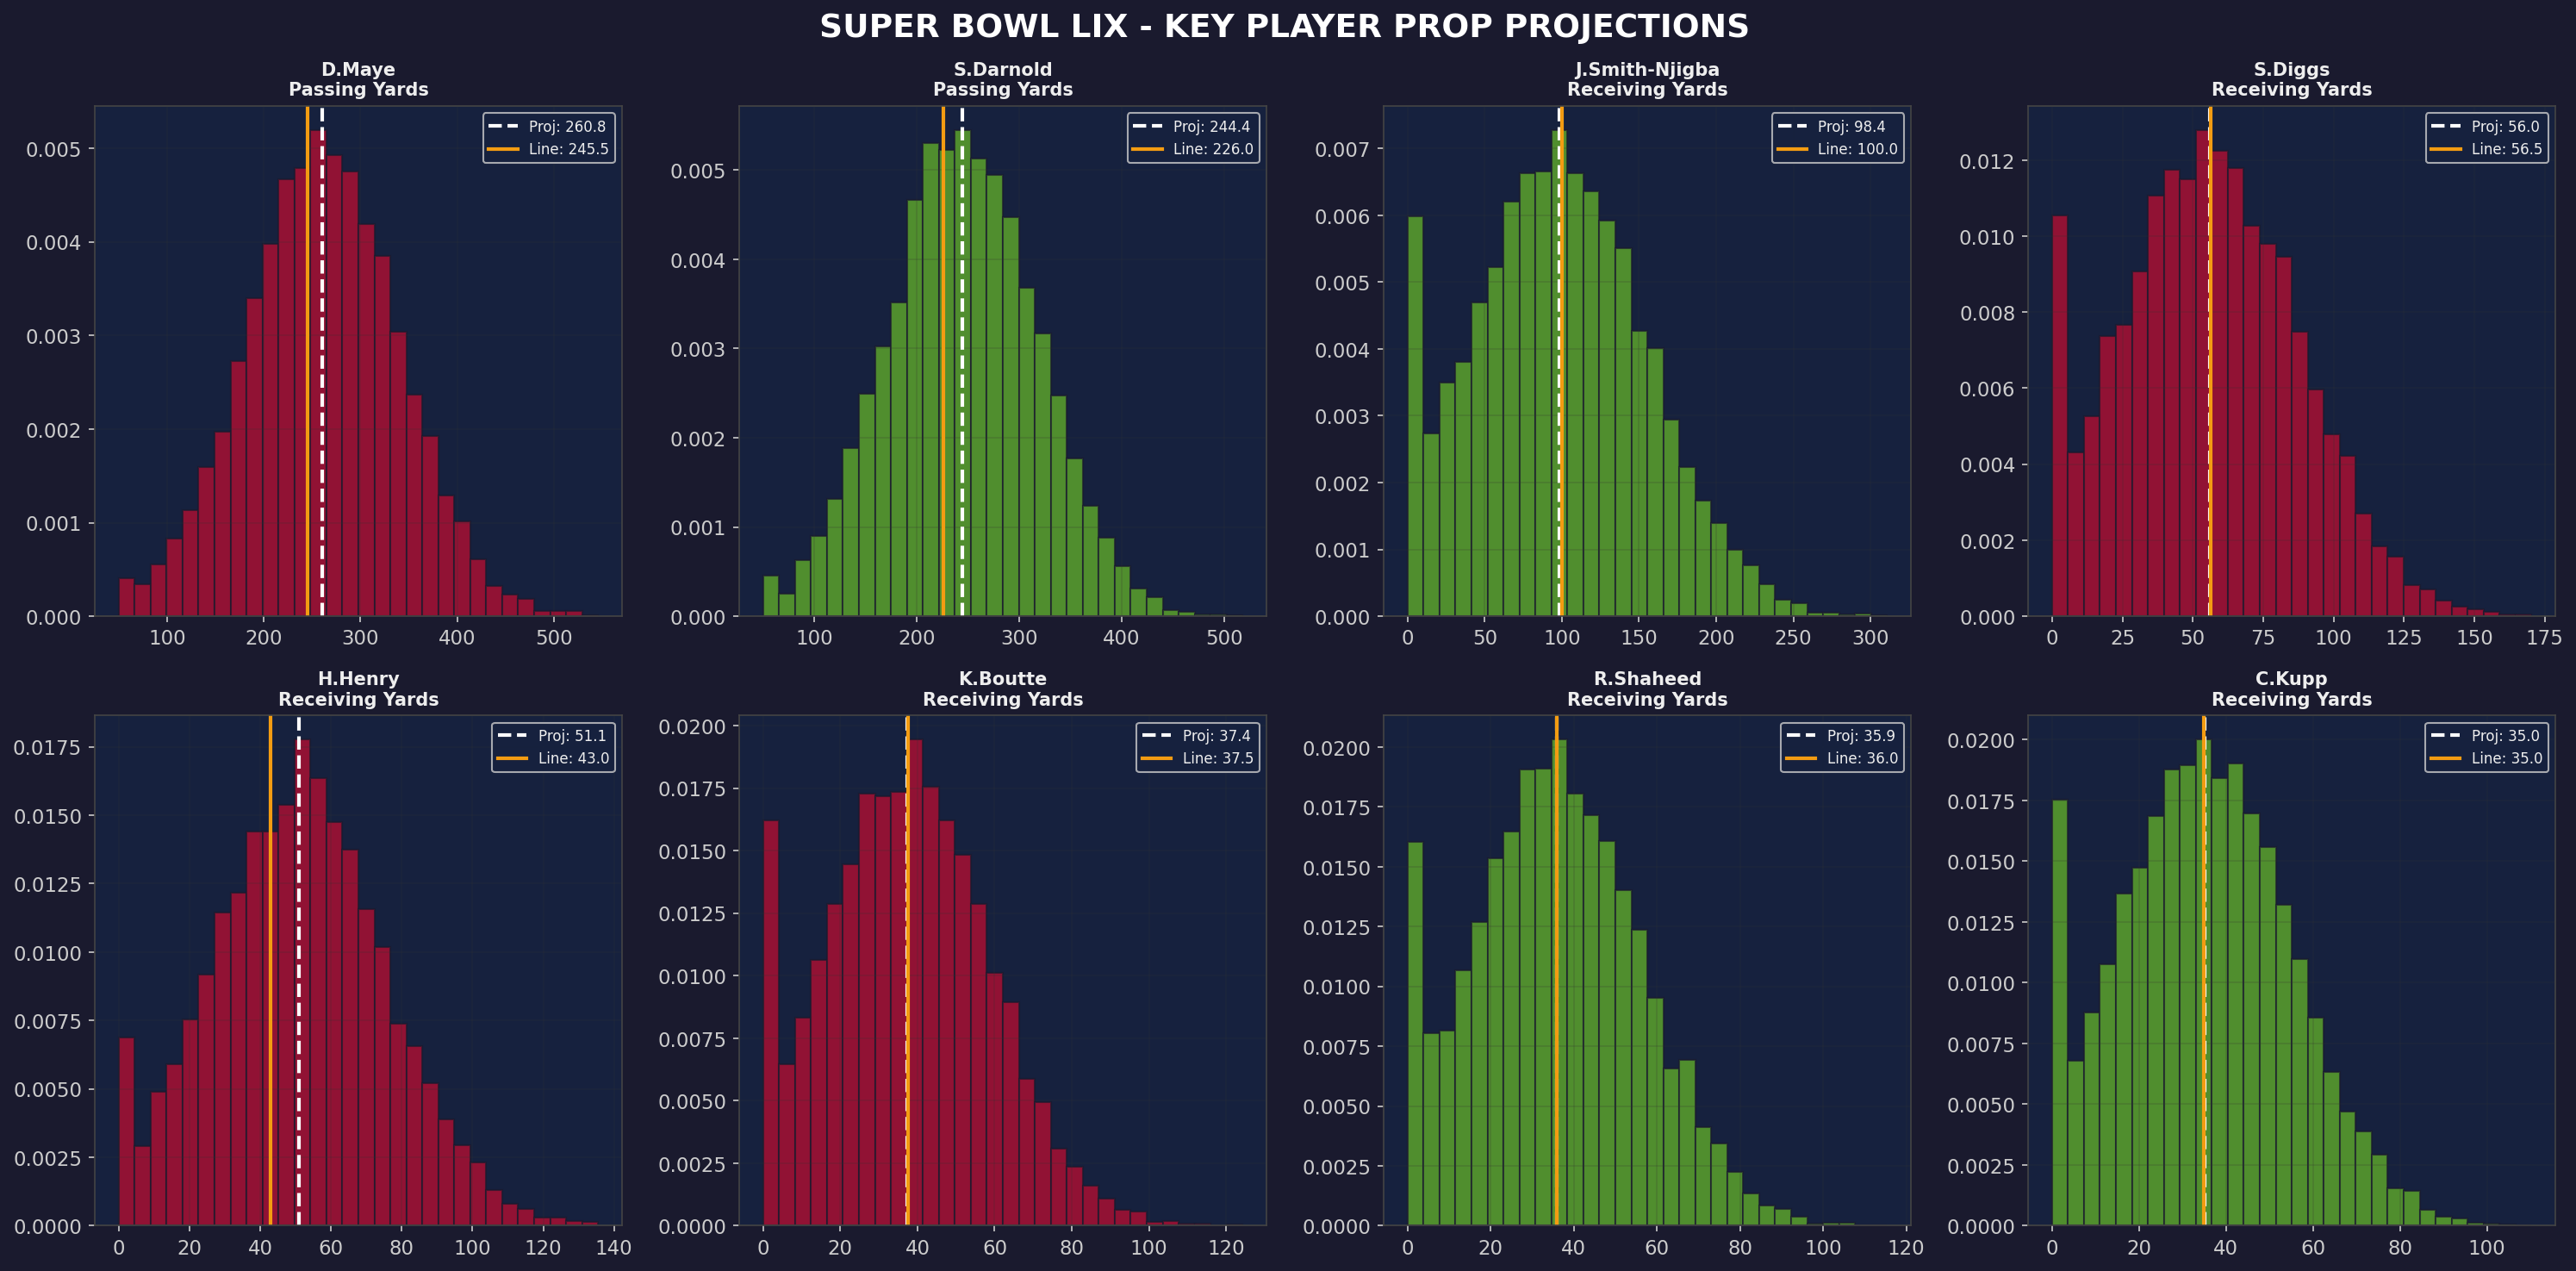
Sharpest line: JSN receiving yards 100.0 (model: 98.6). When Vegas nails one, the rest might leak.
The Portfolio (51% of Bankroll)
Main bets (32%):
Patriots ML +184: 12%
Patriots +4.1: 10%
Over 41.8: 10%
Prop parlays (19%):
4-leg (7%): Henry + Barner + Darnold yards/TDs → 13.5% win rate, 13-to-1 payout
2-leg (12%): Maye + Stevenson yards → 35.2% win rate, 3.7-to-1 payout
Expected return: +32% ROI
What the Charts Show
Win probability: Patriots 58.6% vs market 35.2% = 23% mispricing
Score distribution: Patriots peak at 27, Seahawks at 24. Close game, Patriots edge.
Total points: Model average 51.6 vs line 41.8. Over hits 74.4% of sims.
Betting edges: All three main bets clear the 10% high-conviction threshold.
The Risk Cases
If Darnold stays perfect: 280 yards, 3 TDs, 0 turnovers. Seahawks 31-24. I lose Patriots bets, hit Over.
If Patriots grind: Revert to 18 PPG playoff style, win 17-13. Lose Over, cash Patriots.
If model’s right: Patriots 27-24. Everything hits. +32%.
Why This Works
The model processes 34 stats × 33 players without recency bias. It sees Patriots’ 17-game offensive dominance that Vegas is discounting for 2 playoff games of Darnold magic.
The edge exists because:
Casual money sees -225 and assumes blowout
Sharp money sees a coin flip at +184 and pounces
This isn’t gambling. It’s systematic mispricing exploitation.
The Bottom Line
Finding 25% edge on the Super Bowl → the most efficient market in sports…
shouldn’t be possible.
But it’s there because the model separates signal from noise in small samples better than humans can.
If I’m right, this is the score of the year.
If I’m wrong, I learn and recalibrate.
Patriots +184. Over 41.8. Quant vs Vegas.
Disclaimer: This is for educational purposes only.