
Bloomberg Added a Hormuz Chokepoint Monitor. Here's What the Data Shows.
A new Bloomberg terminal function gives you real-time vessel transit counts through the Strait of Hormuz. The numbers since the Feb 28 strike are extraordinary.

If you're running any kind of energy, commodity, or geopolitical trade right now, there is one geographic coordinate you need to be watching daily: 26.5°N, 56.3°E — the center of the Strait of Hormuz. Over 20% of the world's crude oil transits through a corridor less than 40km wide at its narrowest point. Bloomberg now lets you monitor it in real time.
The terminal functions
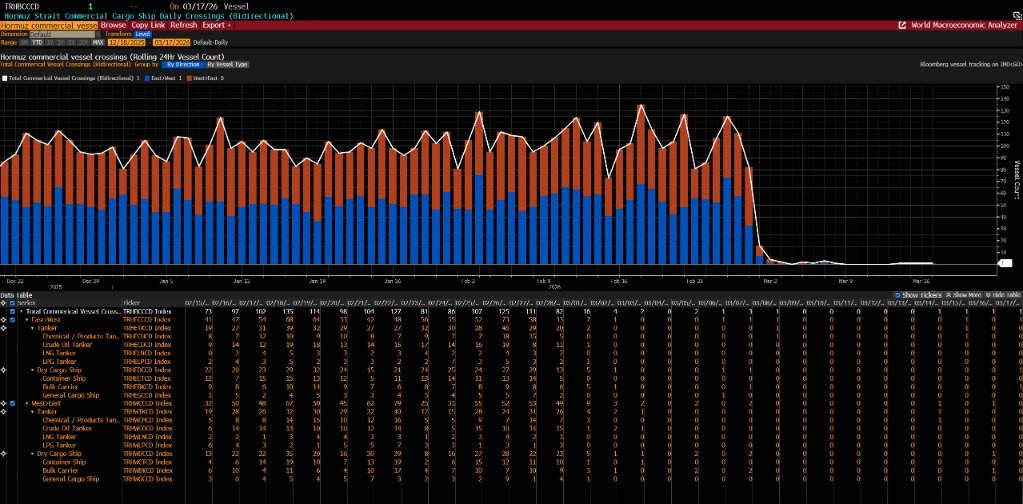
TRHCCCD Index
Bidirectional total — all commercial vessel crossings, rolling 24h count, broken out by vessel type
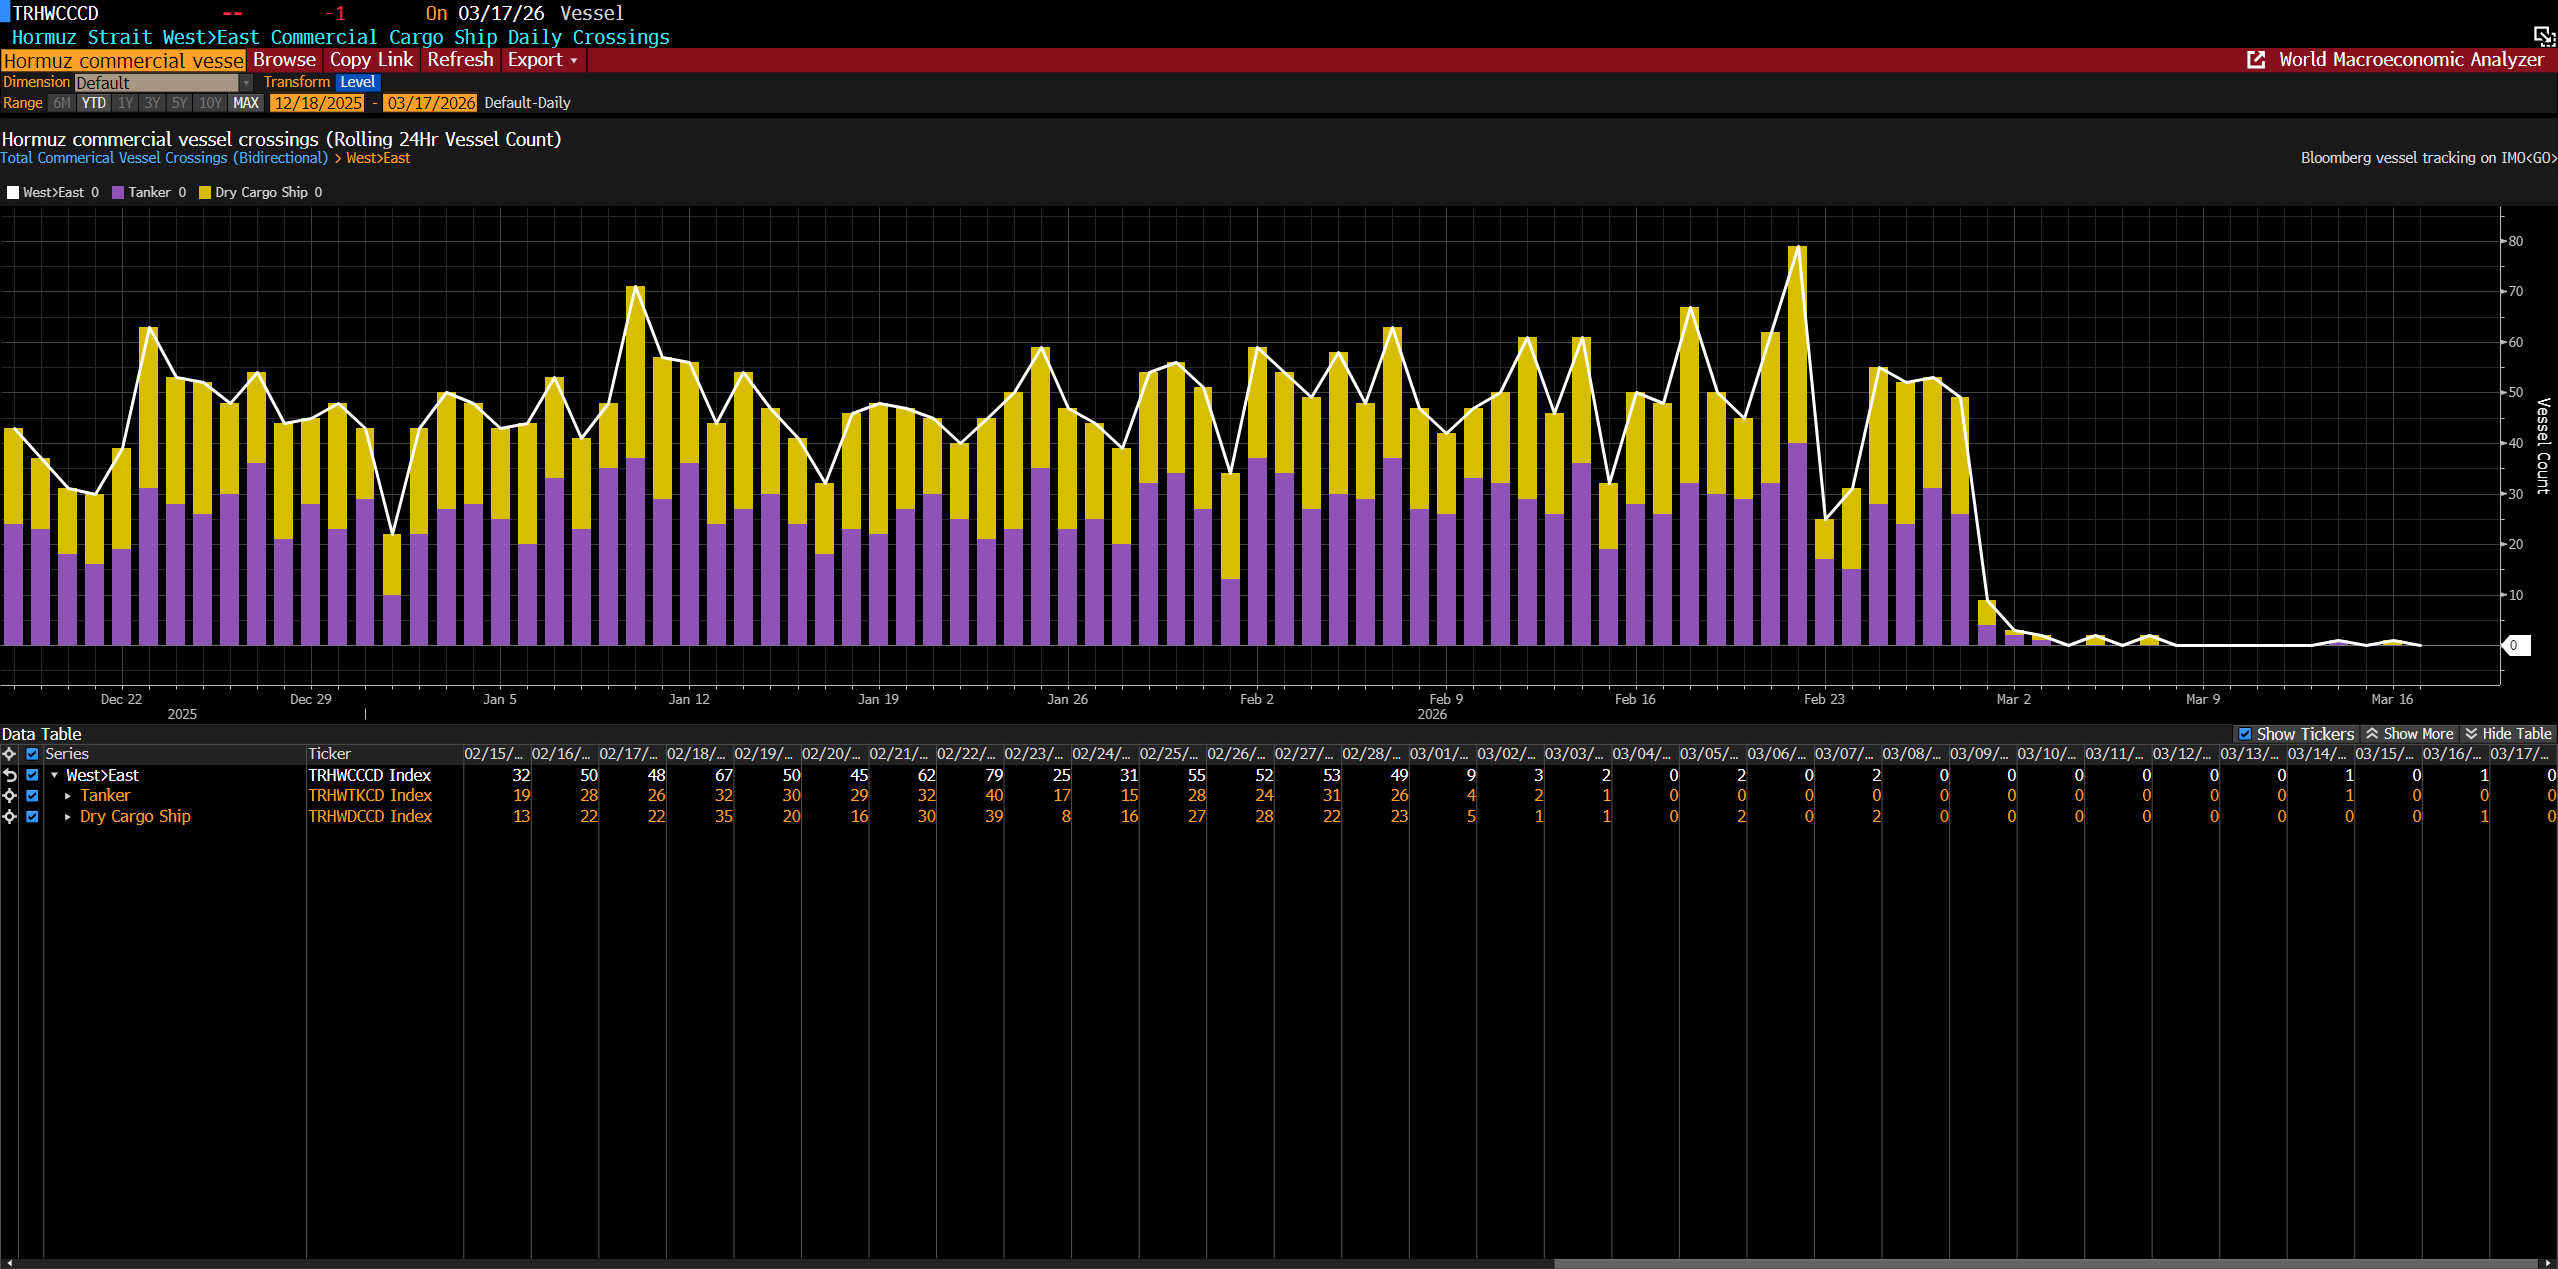
TRHWCCCD Index
West→East flow: oil and cargo moving out of the Gulf toward Asian markets
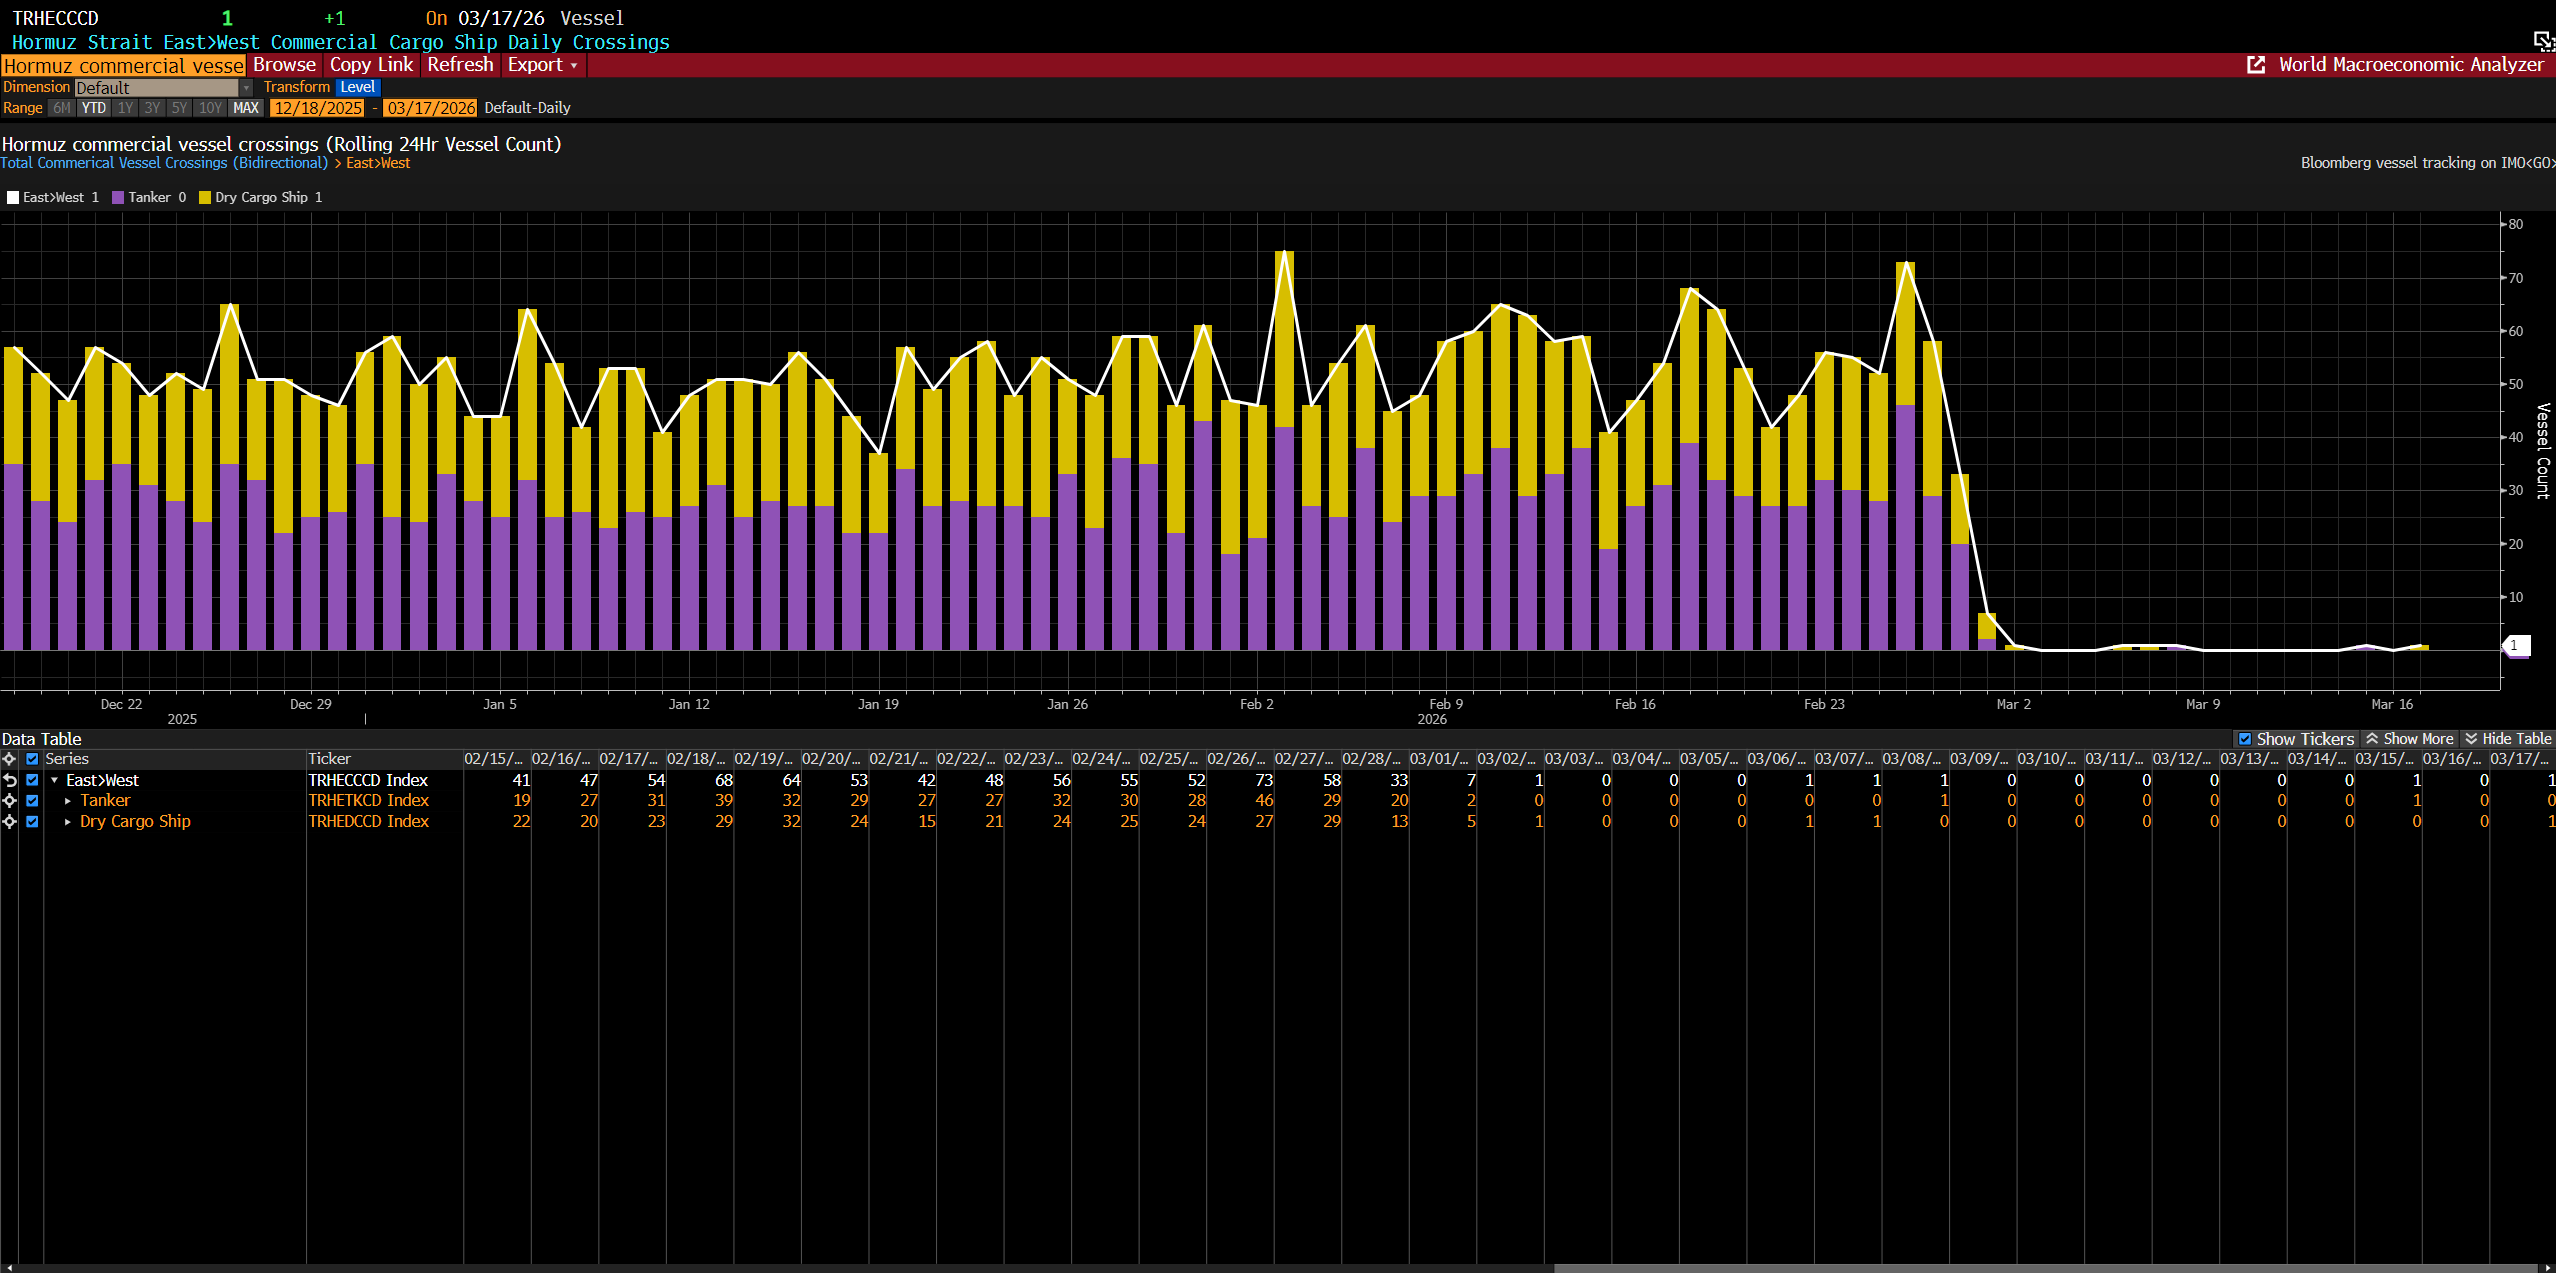
TRHECCCD Index
East→West flow: vessels entering the Gulf — the intake side of the chokepoint
Each function drills further into tanker vs. dry cargo vs. LNG vs. container vessel breakdowns, so you can isolate the specific commodity flow that matters for your book. Bloomberg is tracking IMO vessel IDs and triangulating with AIS data.
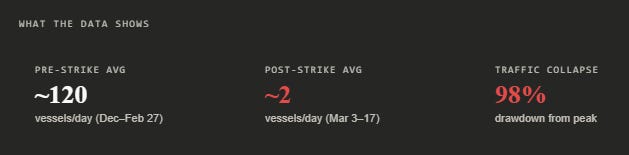
The chart is not subtle. From late December through February 27, the strait was processing 100–150 commercial crossings per day bidirectionally — tankers, dry cargo, LNG carriers, container ships flowing in both directions like clockwork. Then the US-Israel strike on Iran’s nuclear and military infrastructure hit on February 28, and the data falls off a cliff. By March 3, transit counts had collapsed to single digits. They have not recovered. As of today, the rolling 24-hour count is effectively zero.
The East→West direction (TRHECCCD) shows vessels attempting to enter the Gulf dropping to near-zero first — insurance markets repriced overnight, and commercial operators halted sailings before cargoes could be committed. The West→East direction (TRHWCCCD) followed within 48 hours. Tankers specifically flatlined: the TRHETKCD (East tankers) and TRHWTKCD (West tankers) sub-indices both read 0 or 1 on most days since March 3.
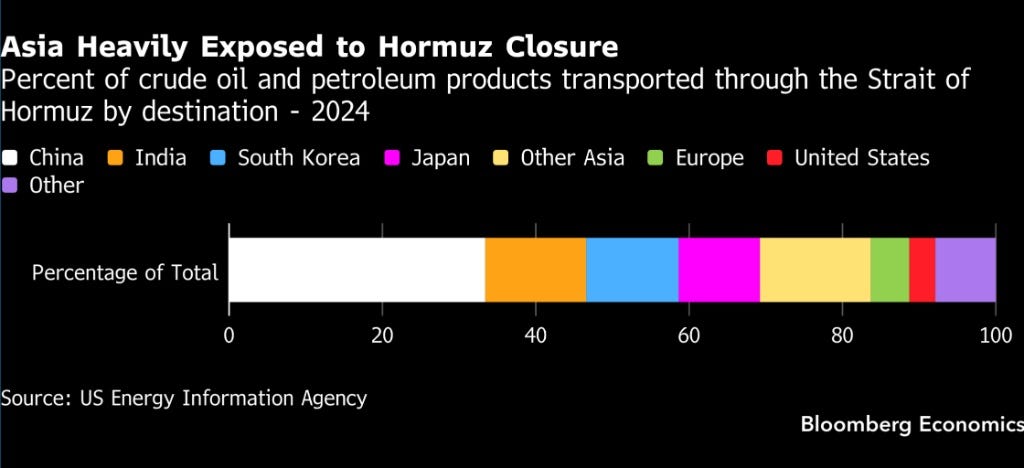
The implication is straightforward: roughly 87% of all crude and petroleum products transiting Hormuz flows to Asia. This is not a US energy crisis — it’s a Pacific Basin supply crisis.
FXI 0.00%↑ China alone absorbs 35% of Hormuz flows. Every day the strait stays closed, Chinese SPR drawdown accelerates and spot procurement shifts toward West African and Russian barrels, driving premium dislocation across the forward curve.
The downstream effects ripple through dry bulk freight (coal rerouting out of Australia and Colombia to fill the gap — HCC 0.00%↑, BTU 0.00%↑), LNG spreads (GLNG and Pacific Basin LNG premiums), and agricultural shipping lane disruption hitting DBA 0.00%↑. This is why Operation Epic Fury is a cascade thesis, not a single-instrument oil play.
What to watch — the reopening signal
The BNO 0.00%↑ put thesis normalizes when the TRHCCCD rolling 24h count rebuilds sustainably past 40–50 vessels/day. We are not close. Right now the strait is reading 1–3 vessels per day — rounding error territory. Until that count shows a consistent multi-day recovery toward historical baseline (~100–120/day), the supply shock premium in crude remains structurally supported. Set a Bloomberg alert on TRHCCCD at 50. That is the trip wire.
The physical flow data will always lead the futures market → that's the edge.