
Aritzia Is Where LULU Was in 2016
Incoming 7x

There is a trade happening in plain sight that almost nobody in the US can see — partly because of where it’s listed, partly because of a narrative hangover from a bad year in 2023, and partly because the most important number in the thesis lives buried in an earnings call transcript that most analysts haven’t read.
The company is Aritzia (TSX: ATZ) (OTCMKTS: ATZAF). The trade is a 2–4x over 36 months. And the setup is almost structurally identical to what Lululemon - LULU 0.00%↑ looked like in 2016 — right before it became one of the best long trades of the decade.
Let me show you exactly what I mean.

First, a History Lesson
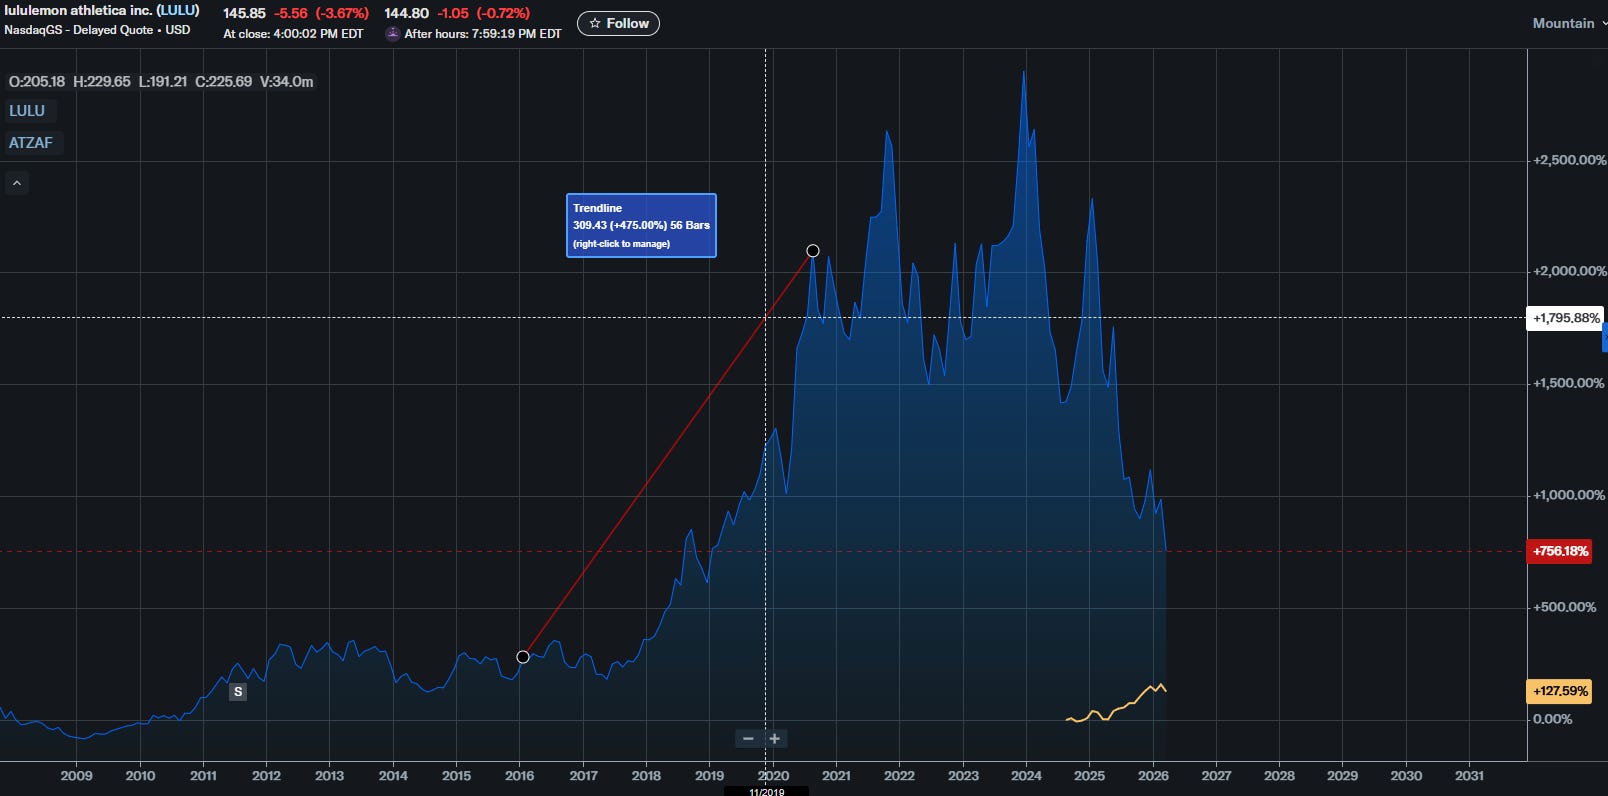
In 2016, Lululemon was a punchline.
The company had just gone through a multi-year nightmare: a supply chain reset, an infamous product recall (the see-through yoga pants debacle), a CEO departure, and a gross margin that had collapsed from ~51% to ~46%. The stock had been cut in half from its 2013 highs. Institutional investors who had been burned wanted nothing to do with it. The sell-side had largely moved on.
The consensus view: Lululemon is just a yoga pants brand that got lucky, and the margin expansion story is over.
What actually happened: LULU’s gross margin went from 46% in FY2016 to 57% in FY2021. The stock went from ~$55 to over $400. A 7x run driven entirely by a thesis that was hiding in plain sight → if you understood what was driving the margin recovery and what came next.
That exact setup is playing out again. The company is different. The product is different. But the financial fingerprints are identical.
What Aritzia Actually Is (vs. What the Market Thinks It Is)
The market thinks Aritzia is a premium Canadian fashion retailer — cyclical, geographically constrained, and still recovering from a painful margin compression episode in FY2024 that burned investors.
I think that perception is wrong.
What is actually happening: Aritzia is executing a Lululemon-2014-style US market penetration, with only 72 US boutiques open today against a long-term target of 180–200+. The US already represents 62%+ of total revenue and is growing at +45–54% YoY. The company’s CEO, Jennifer Wong — who has been with Aritzia for 39 years — said on the most recent earnings call:
“I’ve been with the company now for a very long time. I’m coming up on 39 years, and I’ve never been more excited about the business as I am right now.”
That is not a boilerplate statement. A founder-operator with nearly four decades of institutional knowledge deploying “never been more excited” is a very specific, personal conviction signal. I pay attention to those.
The Numbers That Matter
Before I get into the LULU comparison, here’s where Aritzia’s business actually stands today:
Revenue growth: ~33% YoY LTM — running faster than Lululemon at a comparable revenue scale
EBITDA margin: ~21.4% — virtually identical to LULU FY2017–18 (21.3–21.7%)
Boutique payback periods: Under 12 months vs. a 12–18 month target. Improving as they scale, not deteriorating. This is the single most important unit economics data point.
Free cash flow: Swung from -CAD $68M in Q1 FY25 to +CAD $286M in Q3 FY26 — in five quarters.
Balance sheet: CAD $620M cash, zero debt. On track to exceed $1 billion cash by FY2027.
US active client growth: +40% YoY for two consecutive quarters. Organic awareness, not promotional pull.
The business is not recovering. It is accelerating!
The LULU Comparison — Mapped Precisely
I ran Aritzia’s current financial profile against Lululemon’s historical financials year by year to find the closest analog. The answer is uncomfortable for the bears.
Aritzia today most closely resembles Lululemon in late FY2017/early FY2019 — past the operational trough, in the middle of its US buildout, with EBITDA margins converging toward prime-LULU levels. But with one critical structural difference that makes the ATZ setup potentially more compelling than the LULU setup was:
Aritzia is generating comparable revenue with 3x fewer doors.
When LULU was generating $2.3–2.6B in revenue, it had ~411 stores. Aritzia is generating a comparable CAD revenue base with just 139 boutiques. That means Aritzia’s revenue per boutique is roughly 3x higher than LULU’s was at the same stage. Higher-format flagships. E-commerce carrying more load. Both are structurally positive — the remaining 60+ US boutiques needed to hit management’s target are starting from a higher productivity base than LULU ever had.
Here’s the comparative scorecard:
Revenue growth — LULU FY2019: +24% / ATZ LTM: +33% → ATZ wins outright. Growing faster on a comparable revenue base.
Gross margin — LULU FY2019: 55.2% / ATZ LTM: ~44.8% → LULU ahead by ~1,000 bps. This is the single unproven chapter of the ATZ thesis and the number to watch every quarter.
EBITDA margin — LULU FY2019: 25.2% / ATZ LTM: ~21.4% → LULU ahead, but the gap is closing. ATZ is already running above LULU’s FY2017–18 EBITDA profile on a tariff-adjusted basis.
FCF trajectory — Both accelerating sharply off trough. ATZ swung from -CAD $68M to +CAD $286M in five quarters. Comparable inflection shape.
Store count vs. revenue — LULU FY2019: 440 stores generating $3.3B / ATZ LTM: 139 boutiques generating ~$3.4B CAD → ATZ wins decisively on productivity. Revenue per door is approximately 3x higher, meaning remaining US openings start from a structurally better base.
Buildout runway — LULU was mid-cycle in FY2019. ATZ is early-cycle with 72 of 200 target US boutiques open. More compounding runway remaining.
The One Number That Decides Everything
There is a single metric that will determine whether this trade re-rates like LULU did or plateaus as a well-run retailer with a ceiling.
Gross margin.
LULU’s entire re-rating story — the reason the stock went 7x from trough to peak — was built on gross margin expansion from ~46% to ~57% over five years. Every leg of the stock’s move corresponded to a specific gross margin trigger:
Leg 1 (+55%): Gross margin confirmed a floor. Trough is behind us. Multiple expanded from ~25x to ~35x.
Leg 2 (+65%): Gross margin broke 53% as DTC mix shifted and menswear ramped. New investor base entered.
Leg 3 (+70%): Gross margin hit 55%+ and the narrative shifted from “premium yoga brand” to “luxury lifestyle compounder.” Multiple broke 50x.
Aritzia’s gross margin trajectory is following the same shape with an 8-quarter lag. ATZ’s trough was Q2 FY24 at 34.99% — the company’s equivalent of LULU’s 2016 capitulation. It has since recovered to 47.15% in Q1 FY26. That is 1,216 basis points of recovery in eight quarters.
The language from Aritzia’s CFO on the Q3 FY26 call:
“The increase in gross profit margin was driven by IMU improvements, lower markdown rates, savings from our smart spending initiative and lower warehousing costs.”
That is word-for-word the same language Lululemon’s management used during Phase 2 of their gross margin recovery. Same playbook. Same execution. Same results so far.
The next chapter — Phase 3 — requires e-commerce mix shift to start accreting to gross margin the way LULU’s DTC ramp did between FY2019 and FY2020. LULU’s e-commerce went from 12% of revenue in FY2015 to 26% by FY2019, adding 300+ basis points of structural gross margin expansion in the process. ATZ’s e-commerce is growing 30%+ but currently adding fulfillment cost, not removing it. That reversal — confirmed by Q2 gross margin printing above 45% — is the single most important catalyst to watch.
The target number: 47% gross margin. If ATZ crosses that threshold on a sustained basis, the Leg 2 re-rating trigger fires.
Why The Stock Is Suppressed (And Why That’s Your Edge)
Here is the honest answer to why a business growing 33% with $620M cash, zero debt, accelerating FCF, and boutique paybacks under 12 months is trading at a ~35x forward P/E instead of 45–50x:
1. It’s a TSX-listed stock. US growth funds that would own a LULU analog cannot easily buy a CAD-denominated Toronto-listed security. Only 85 US institutions have filed positions in the OTC-traded ATZAF. Compare that to LULU at a similar stage — overwhelmingly institutionally owned by US growth funds.
2. FY2024 scar tissue. The stock dropped 65% in 2023 on the margin compression episode. Institutional memory is viscous. Funds that got burned are on the sidelines waiting for proof points that — when they arrive — will already be priced in.
3. Style box exile. US growth funds screen it out because it’s “Canadian.” Canadian funds look at 35x P/E on a “fashion retailer” and pass. It falls through the cracks of two separate institutional mandates simultaneously.
4. The CAD/USD translation friction. ATZ reports in CAD but 62%+ of revenue is USD. Analysts doing a quick screen see CAD-denominated numbers and underestimate the actual USD economic reality.
Every single one of these factors is a temporary structural condition, not a fundamental problem. And the catalyst that resolves all of them simultaneously is a US exchange listing — which becomes economically inevitable as the US boutique count crosses 100+ and revenue approaches $4B+ CAD.
This is exactly what Lululemon did in reverse. LULU listed primarily on Nasdaq with a secondary TSX listing, then delisted from the TSX entirely in 2013, stating that “Nasdaq accounts for nearly all of the company’s current trading volume.” ATZ is running the same movie backwards. The end state is the same: one dominant exchange, and it will be American.
The Shopify precedent makes this more likely, not less. Shopify moved its primary US listing to Nasdaq in March 2025, triggering immediate S&P 500 eligibility speculation. The template is established. The Canadian technology and growth company playbook now explicitly includes US exchange migration as a standard scaling move.
The Price Target Framework
Based on the LULU re-rating playbook mapped to ATZ’s current financial profile:
Bear case (12 months): CAD $70–96 — US consumer cracks, comps go negative, gross margin stalls at 43–45%, multiple de-rates to 25–30x. Downside: -38%.
Base case (24 months): CAD $190–253 — Phase 2 holds, FY27 guidance raises EBITDA target above 19%, Q2 FY27 gross margin prints above 45%. Multiple expands to 38–44x. Upside: +70–126%.
Bull case (36 months): CAD $338–425 — Full LULU replay. Gross margin crosses 50%, US boutique count hits 120+, US listing announced, institutional mandate unlocks. Multiple re-rates to 45–50x. Upside: +200–280%.
The asymmetry: approximately 6:1 reward-to-risk at current levels.
The Gate Map — What to Watch and When
I’m tracking six sequential catalysts:
Q4 FY26 earnings (April/May 2026) — Can ATZ lap +26% comps? If yes, add.
Q2 FY27 gross margin (Oct 2026) — Above 45% = Phase 3 activated. This is the most important single print.
100 US boutiques crossed (late 2026/early 2027) — The psychological milestone that breaks the “Canadian retailer” narrative.
Revenue crosses CAD $4B (FY2027) — Index eligibility threshold.
US dual listing announcement (late 2027/early 2028) — Re-rates 15–25% on announcement day alone as US institutional mandates unlock overnight.
S&P/Russell index inclusion (2028–2029) — Passive money forced to buy. This is the exit.
We’re currently at Gate 1. You have approximately 24–30 months before the mechanical institutional forces take over and make this position expensive to build.
The Positioning Framework
This is not a trade. The FY2027 boutique opening cycle, international e-commerce scaling, and mobile app monetization are all mid-cycle. The re-rating happens when US boutique count crosses 100+ and the consensus realizes the TAM math.
Conviction: Medium-High.
Now (late March 2026): Half position. Seasonal entry in the Q1 trough window. Thesis intact.
Q4 FY26 earnings (May 2026): If comps hold HSD+ and margin guidance raised — add to full position.
Q2 FY27 gross margin (Oct 2026): If 45%+ print confirmed — maximum size.
November 2026 onward: Hold through the re-rating. Trim into any US listing announcement.
The kill switch: If US active client growth — which ran +40% YoY for two consecutive quarters — decelerates sharply below 20%, or if management stops leading with that metric, exit immediately. Everything in the thesis flows from US brand awareness compounding. If that stalls, the re-rating timeline extends indefinitely.
The One-Sentence Version
The market is pricing Aritzia as a recovered Canadian fashion retailer. It is actually a US luxury brand in its earliest stages of national buildout — with only 72 of a potential 200 US locations open, boutique paybacks under 12 months, a mobile app driving 58% e-commerce growth, and structural margins already exceeding their own 19% long-term target when stripped of tariff noise.
The gross margin trajectory is following Lululemon’s post-trough playbook with an 8-quarter lag. The institutional money that will eventually re-rate this stock cannot easily buy it yet. And the catalyst that forces them to — a US exchange listing — is a matter of when, not if.
You are positioned 24–30 months ahead of that event.
Disclaimer: This is not investment advice. Do your own research. All price targets are estimates based on scenario analysis and comparable company frameworks. Past performance of comparable securities does not guarantee future results.